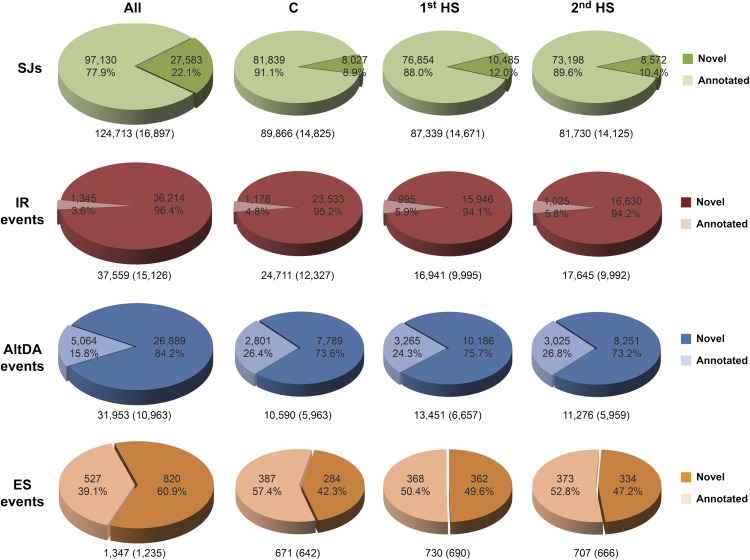
Figure 2.
SJs and AS events in P. patens. SJs, IR, AltDA, and ES events were computed from pooled reads (All) and data of individual samples (control [C], 1st HS, and 2nd HS) by using RACKJ. Numbers of total events and corresponding genes are listed under each pie chart. Numbers and percentages of annotated and novel events are listed in the pie charts.

