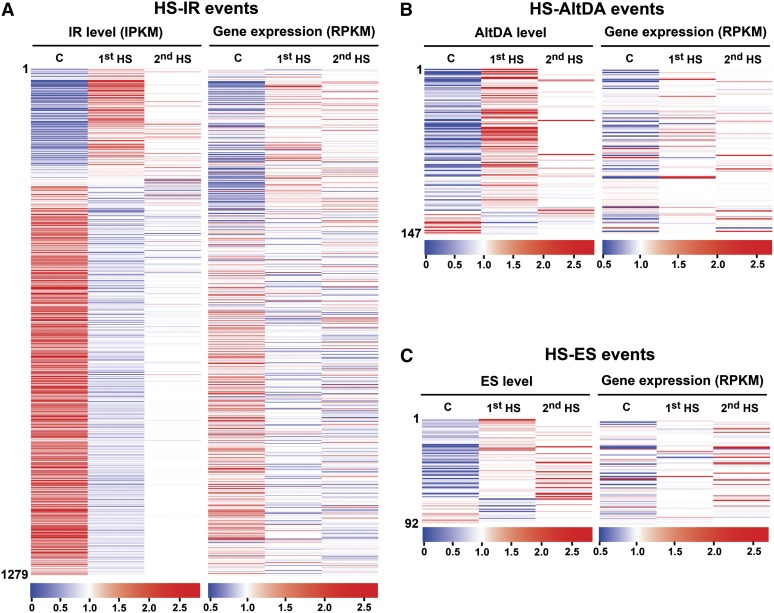
Figure 4.
Heat regulation of AS in P. patens. A, Expression profiles of HS-IR isoforms and corresponding genes. IPKM and corresponding gene expression (RPKM) for the 1,279 IR events were normalized by mean across samples. Events were arranged according to the fold change in IR level comparing 1st HS with control (C) samples. Heat maps of these events in control, 1st HS, and 2nd HS samples are shown. B, Heat maps of the expression levels of HS-AltDA events and corresponding genes. C, Heat maps of the expression levels of HS-ES events and corresponding genes. The scale of expression is shown at the bottom of each map.

