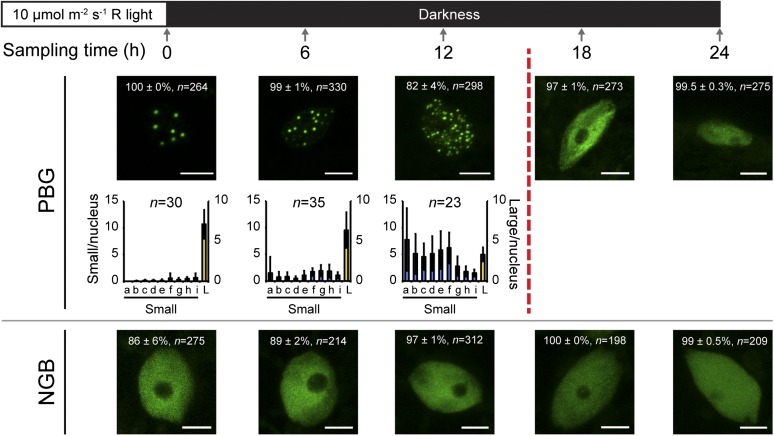
Figure 3.
Loss of photobodies correlates with the accumulation of PIF3. Top, schematic of experimental conditions and sampling time points. Bottom, representative confocal images of PBG (top row) and NGB (bottom row) localization, along with the quantification of photobody number and size in conditions in which at least 50% of nuclei have photobodies. After 12 h in darkness, PBG begins to accumulate PIF3 and PIF target genes are induced (broken vertical red line; Fig. 2). In the confocal images, the percentage value indicates the mean percentage of all analyzed nuclei with the phenotype shown in the image (with or without photobodies; means ± se of at least three independent experiments); n indicates the total number of nuclei analyzed to generate the percentage, and bars = 5 μm. In the graphs, the error bars represent sd and n indicates the number of nuclei analyzed to generate the distribution. The blue bars indicate small photobodies (diameters between 0.1 and 0.72 µm; volumes between 0.0005 and 0.19 µm3), and the yellow bars, plotted on the secondary axis, indicate large photobodies (diameters greater than 0.72 µm; volumes of 0.2 µm3 or greater). Bins represent the following volume ranges, with a to i representing small photobodies and L representing large photobodies: a, 0.0005 to 0.0019; b, 0.002 to 0.0049; c, 0.005 to 0.099; d, 0.01 to 0.019; e, 0.02 to 0.039; f, 0.04 to 0.079; g, 0.08 to 0.119; h, 0.12 to 0.159; i, 0.16 to 0.199; and L, 0.20 μm3 or greater.

