Figure 5.
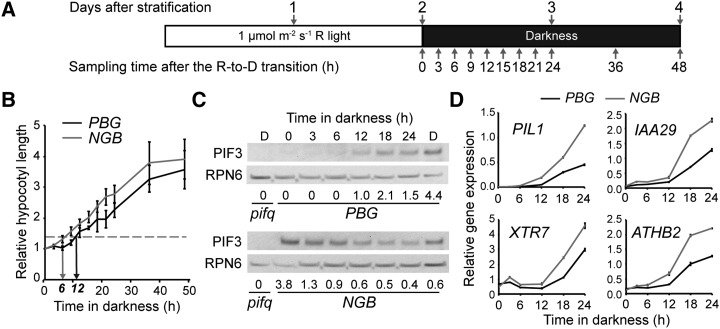
PBG has a reduced capacity for hypocotyl growth inhibition and PIF3 repression after a dimmer, 1 μmol m−2 s−1 R-to-D transition. A, Schematic of the growth conditions and sampling time points for the assay. B, Growth kinetics of PBG (black line) and NGB (gray line). The horizontal dotted line indicates the threshold value of 1.3, and black and gray arrows point to where PBG and NGB cross that threshold (at 12 and 6 h, respectively). Error bars represent the se of three independent experiments. C, Western blots showing PIF3 abundance in PBG (top) and NGB (bottom). PIF3 levels relative to the mean overall PIF3 level within each line are shown below the blots. RPN6 was used as a loading control. Lane D shows a dark-grown control. D, Transcript levels of four well-defined PIF target genes in PBG (black lines) and NGB (gray lines). Data were normalized to PP2A. Error bars represent the sd of three replicates.

