Figure 6.
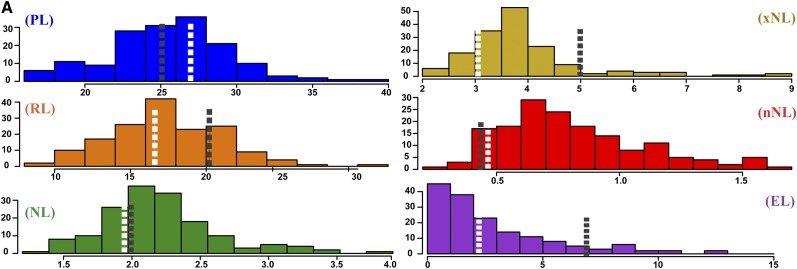
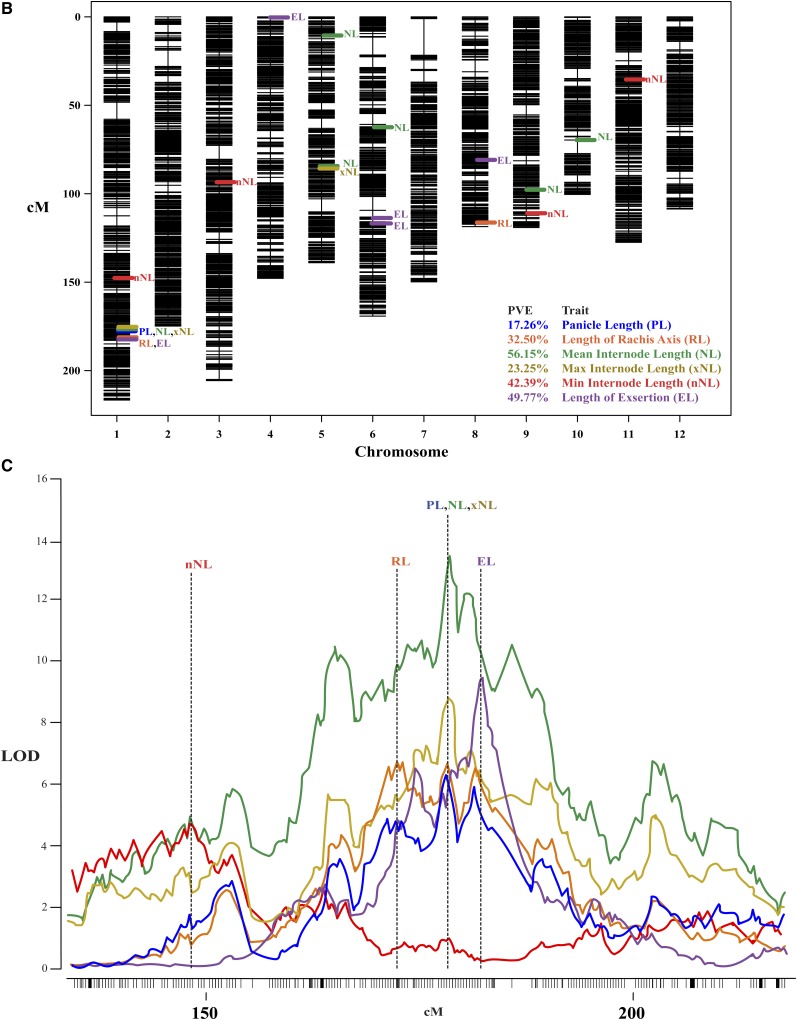
PANorama improved our ability to measure and map for quantitative panicle traits. A, Frequency distributions of phenotypic line means for six traits, calculated using 158 RILs and the two parents of the mapping population. The total number of panicle images was 1, 522. The means for IR64 and Azucena are labeled using black or white dashed lines, respectively. The x axes depict length measurements (cm) for each phenotype. B, Genetic map of the 12 chromosomes in rice, constructed with 30,984 single-nucleotide polymorphisms. PVE indicates total PVE for all QTLs within a trait. C, QTL peaks at the distal end of chromosome 1, shown from approximately 140 cM to the end of the chromosome. The y axis depicts the LOD score calculated for each marker across the region. QTL mapping was performed using Haley-Knott regression and 1,000 permutations to determine a significance threshold for each phenotype; the average threshold for all 6 phenotypes is 3.42 (not shown). LOD profiles show the refined QTL locations after forward selection and backward elimination were used to probe the model space. The peak marker for each trait is depicted using a vertical dashed line.


