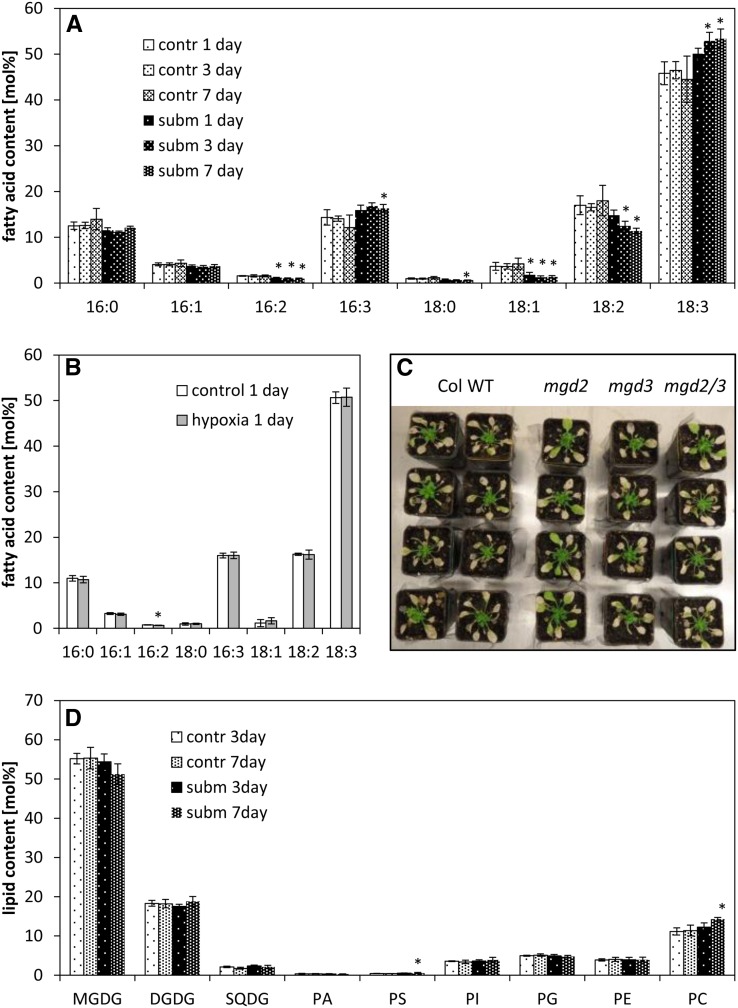
Figure 2.
Membrane lipid contents and composition under hypoxia or submergence. A, Fatty acid composition (mol %) of leaves from plants that were exposed to submerged (subm) or control (contr) conditions for 1 to 7 d. Data are means ± sd for four independent biological replicates. Asterisks mark significant differences between control and submerged conditions (P < 0.05, Tukey’s honestly significant difference mean-separation test). B, Fatty acid composition (mol %) of seedlings treated with hypoxic conditions for 24 h. Data are means ± sd for three independent biological replicates. Asterisks mark significant differences between control and hypoxic conditions (P < 0.05, Tukey’s honestly significant difference mean-separation test). C, Survival of the wild type (WT) and mgd2/mgd3 mutants under submergence. Four-week-old plants were submerged for 4 weeks in a short-day rhythm. Photos were taken after 2 weeks of recovery. The experiment was repeated three times with similar results. D, Lipid composition (mol %) of leaves from plants exposed to submerged (subm) or control (contr) conditions for 3 and 7 d. Data are means ± sd for five replicates. Asterisks mark significant differences between control and submerged conditions (P < 0.05, Tukey’s honestly significant difference mean-separation test). Fatty acid composition of each lipid is presented in Supplemental Figure S3. PA, Phosphatidic acid; PE, phosphatidylethanolamine; PG, phosphatidylglycerol; PI, phosphatidylinositol; PS, phosphatidylserine; SQDG, sulfoquinovosyldiacylglycerol.

