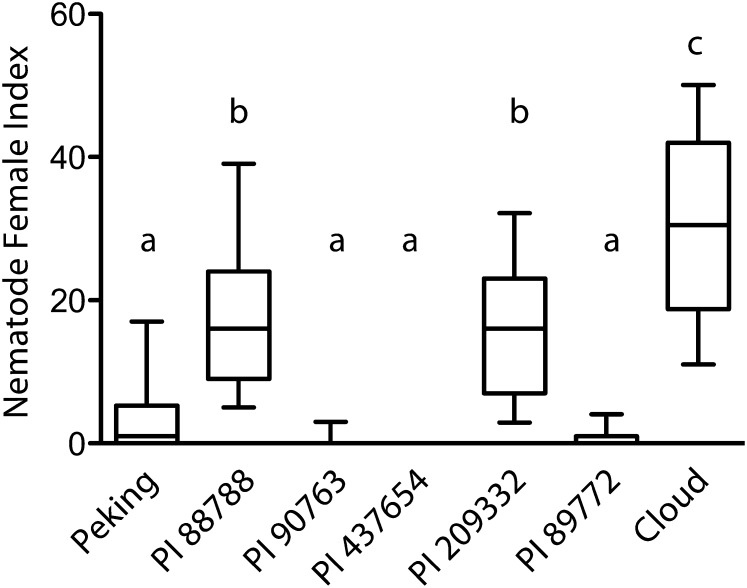
Figure 6.
Nematode resistance data from 78 diverse SCN populations indicate similarities in resistance profiles based on copy number. Nematode development data were obtained for the seven Hg Type Test SCN-resistant lines for greenhouse assays conducted as part of the 2009 to 2012 Northern Regional SCN Tests. The data analyzed for 78 SCN populations were collected from 12 U.S. states and Canadian provinces. Female index is the percentage of SCN cysts that developed on the resistant soybean line relative to the susceptible control soybean line. Boxes show median and 25% to 75% range of data; whiskers extend to 10% and 90% of the data. For statistical analysis, variance was calculated by random replacement with 1,000 bootstrap replicates for each line within a given nematode population (see “Materials and Methods”). This calculated variance was used in a weighted ANOVA; soybean lines not sharing the same letter above the whisker had significantly different means following Bonferroni correction for multiple testing at P < 0.001.

