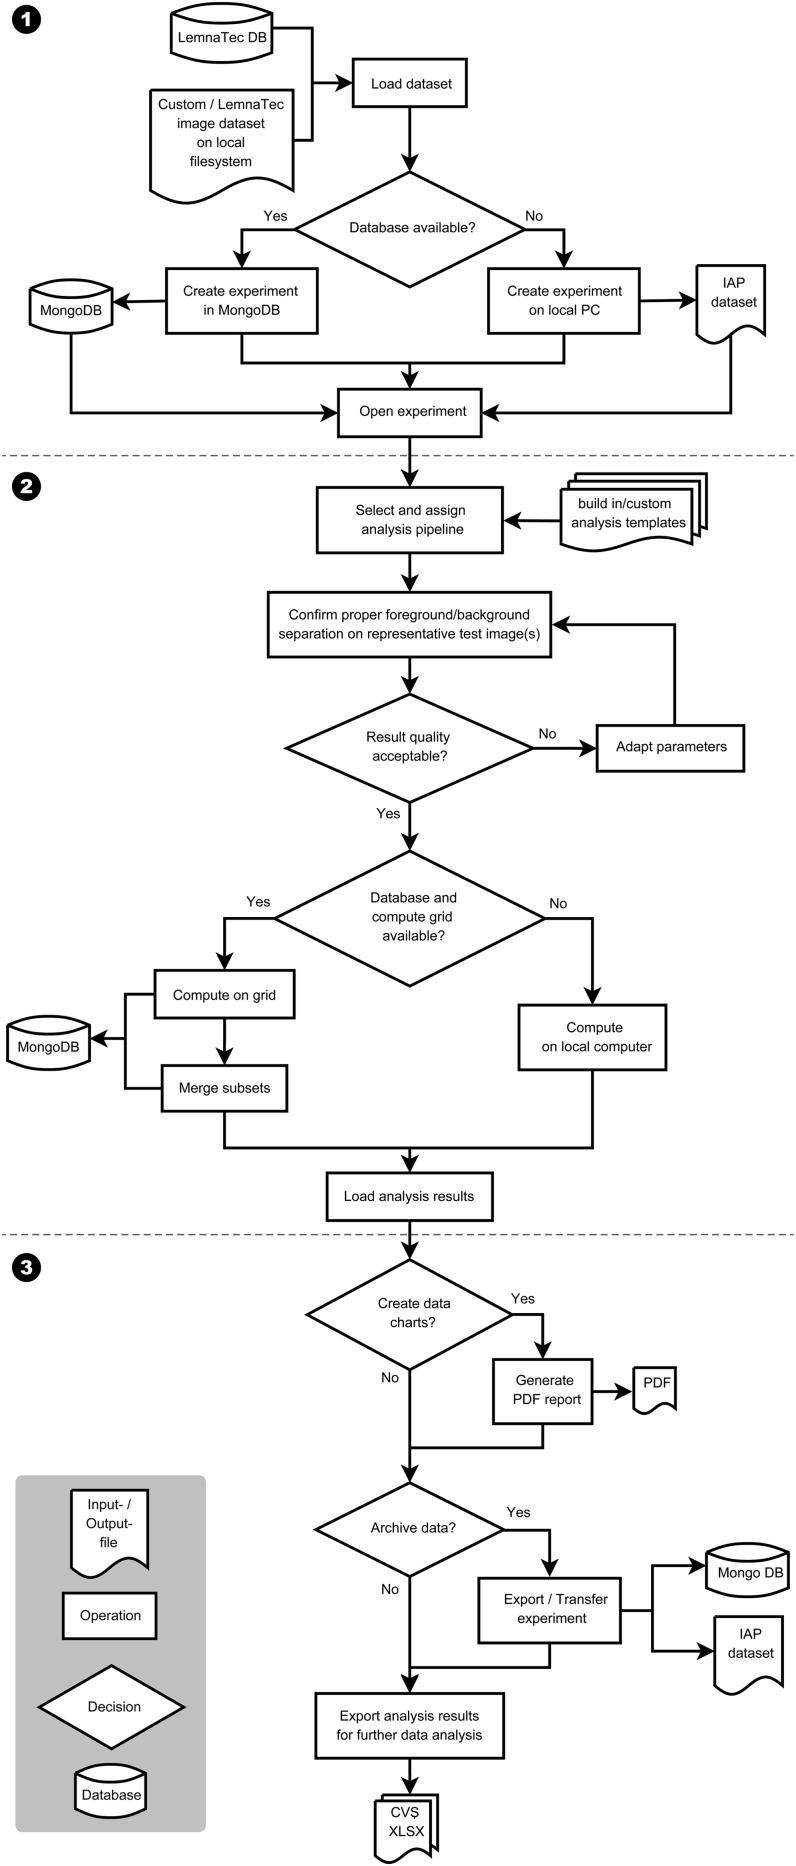
Figure 2.
A typical workflow for analyzing imaging data from high-throughput plant phenotyping experiments with IAP. Numbers indicate three main steps of the workflow: (1) loading/importing data set and experiment creation; (2) parameter optimization and image data analysis; and (3) report generation and result export.

