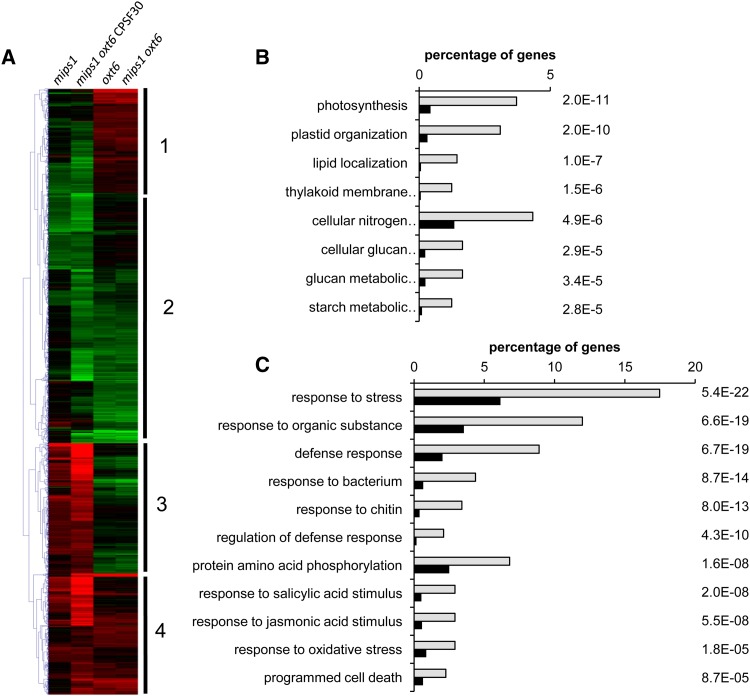
Figure 3.
Characterization of gene networks deregulated by the mips1 and oxt6 mutations. A, Hierarchical clustering of genes differentially expressed in at least two genetic backgrounds. Red and green correspond to up- and down-regulated expression, respectively. B and C, Enriched GO terms of cluster 1 genes (B) and cluster 3 genes (C). Analyses were performed with the agriGO online software (Du et al., 2010). Light gray bars represent the percentage of genes corresponding to each GO term among genes in the cluster, whereas black bars represent the percentage of genes corresponding to these GO terms in the whole Arabidopsis genome. All of these terms were significantly enriched (P values are indicated to the right of the graphs).

