Figure 3.
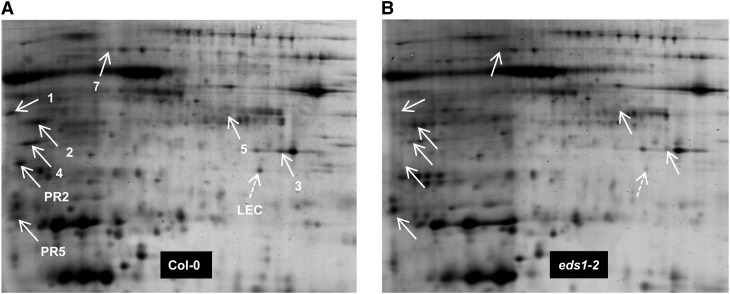
2D gel analysis of apoplast-enriched extracts from AvrRpm1-HA-expressing Col-0 (A) and eds1-2 mutant (B) plants. Isoelectric focusing was performed along the horizontal axis across a pI range from 4 to 7, and proteins were resolved according to their mass along the vertical axis on 12% (w/v) polyacrylamide gels. White arrows indicate the positions of AED proteins. A putative lectin encoded by At3g16530 was identified on this gel set only and is marked with the dashed arrows (LEC). Numbers correspond to the number of each AED protein in Table I. This experiment was repeated multiple times (for reproducibility per spot, see Supplemental Fig. S4).

