Figure 6.
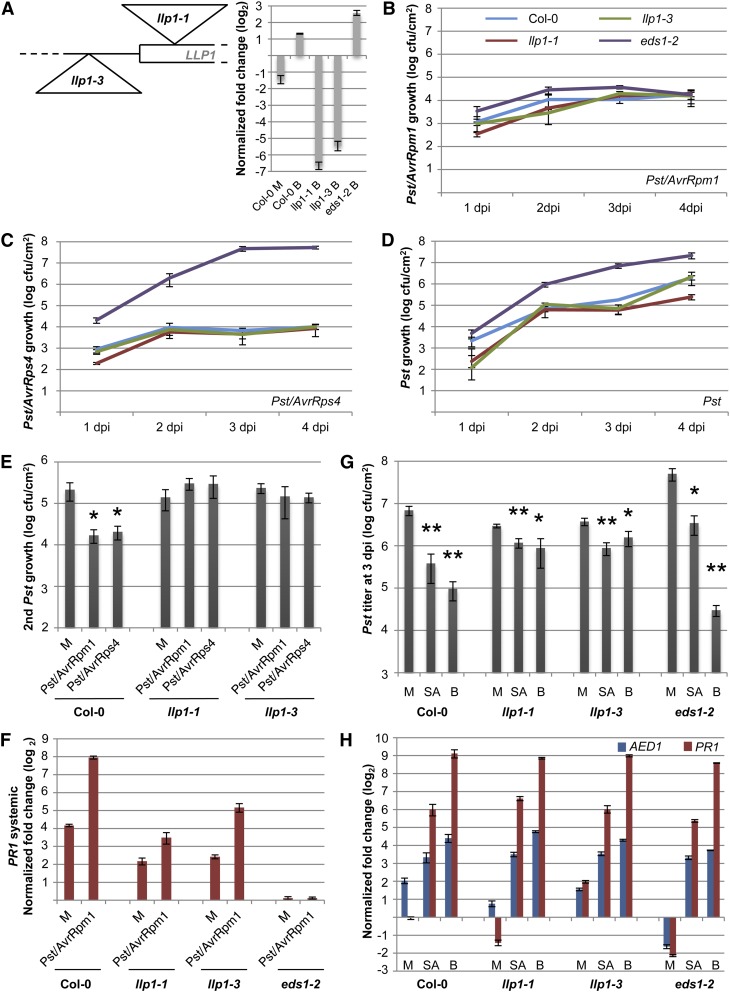
LLP1 promotes SAR. A, Schematic drawing of the positions of the llp1-1 and llp1-3 T-DNA insertions near the start codon of LLP1 and transcript levels of LLP1 normalized to UBIQUITIN in the Col-0, llp1-1, llp1-3, and eds1-2 plants 24 h after infiltration of the leaves with 10 mm MgCl2 (mock; M) or with 100 µm BTH (B; inset). Transcript accumulation is shown relative to that in untreated Col-0 plants. B to D, Growth curves of Pst/AvrRpm1 (B), Pst/AvrRps4 (C), and Pst (D) in the wild-type (blue), llp1-1 (red), llp1-3 (green), and eds1-2 (purple) plants. The bacterial titers in the infected leaves were determined at 1, 2, 3, and 4 dpi. E, SAR in Col-0, llp1-1, and llp1-3 plants. Pst titers are shown 4 d after a secondary infection that was systemic to primary treatments with 10 mm MgCl2 (M) or with Pst/AvrRpm1 or Pst/AvrRps4. F, Systemic PR1 induction. PR1 transcript levels were normalized to UBIQUITIN in the systemic untreated leaves 3 d after a primary treatment of Col-0, llp1-1, llp1-3, and eds1-2 plants with 10 mm MgCl2 (M) or Pst/AvrRpm1. G and H, SA-induced resistance in the llp1 mutants. Col-0 and llp1-1, llp1-3, and eds1-2 mutant plants were sprayed with 0.01% (v/v) Tween 20 (mock; M) or with 1 mm SA or 1 mm BTH (B) in 0.01% (v/v) Tween 20. After 24 h, leaves of the treated plants were either infected with Pst (G) or harvested for qRT-PCR analysis (H). In G, the in planta Pst titers are shown at 4 dpi; in H, the transcript levels of AED1 and PR1 were normalized to UBIQUITIN and are shown relative to those in untreated Col-0 plants of the same age. Asterisks indicate significant differences from the mock-treated controls (*P < 0.05, **P < 0.005, Student’s t test). These experiments were repeated two times (E [Pst/AvrRps4], F, and H) to at least three times (A–D, E [Pst/AvrRpm1], and G) with similar results.

