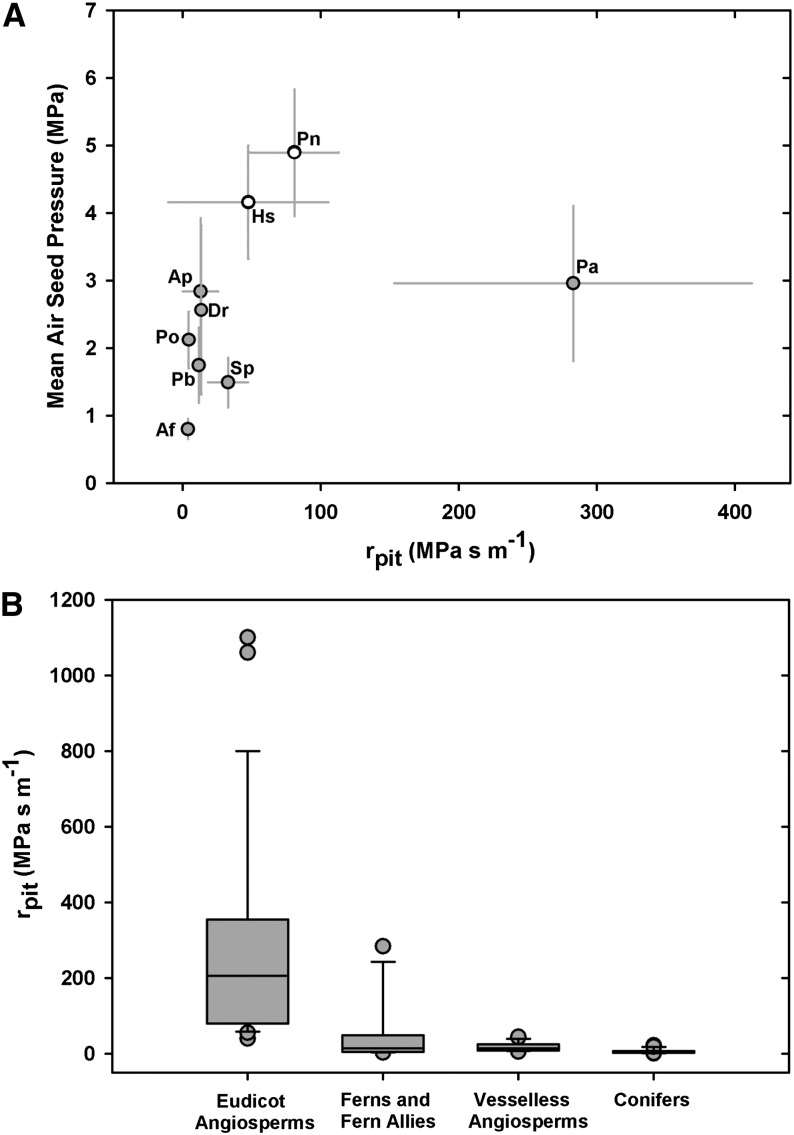
Figure 7.
A, Area-based rpit in ferns (gray circles) and fern allies (white circles) in relation to mean ASP. B, Box plots showing the rpit of four functional plant types, where the box indicates the middle half of the sampled data, the line shows the sample median, and the whiskers show the upper and lower quarters of the distribution. Points outside the whisker range are considered outliers, such as P. aquilinum in the fern data set. Conifer data are from Pittermann et al. (2006), vesselless angiosperm data from Hacke et al. (2007), and vessel-bearing angiosperm data from Wheeler et al. (2005) and Hacke et al. (2006). Additional fern data are from Schulte et al. (1987) and Wheeler et al. (2005).

