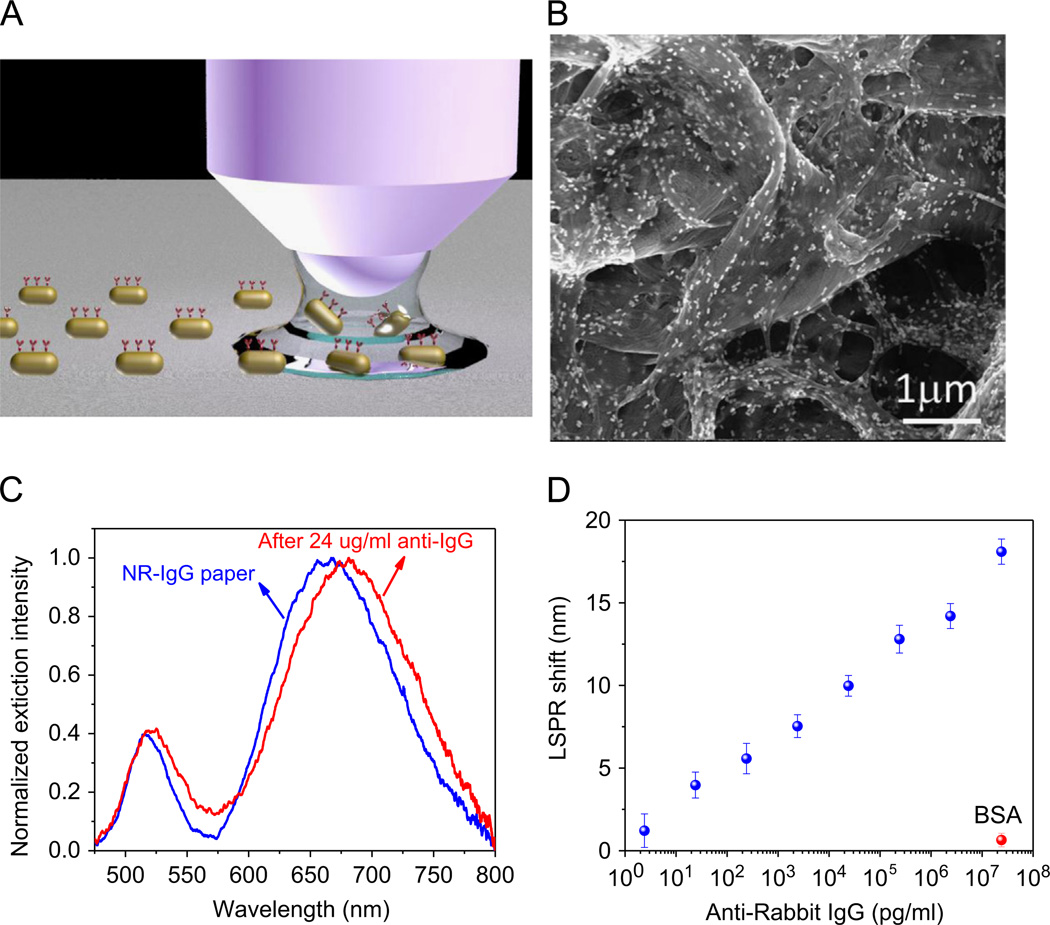
Fig. 4.
(A) Schematic illustration of the concept of bioplasmonic calligraphy. (B) SEM images of NR–IgG conjugates adsorbed on paper substrates by bioplasmonic calligraphy approach. (C) Extinction spectra of AuNRs–IgG conjugates on the paper substrate before (blue) and after binding of anti-IgG (red). (D) Plot showing the LSPR peak shift of bioplasmonic paper for various concentrations of anti-IgG and BSA. (For interpretation of the references to color in this figure caption, the reader is referred to the web version of this paper.)

