
Figure 1.
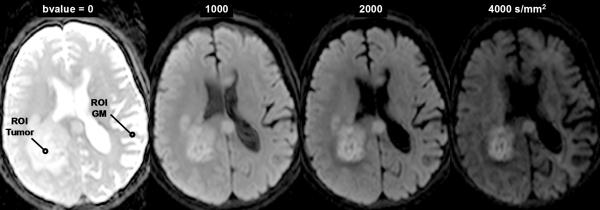


DWI contrast at high b-value in a 61yo patient with a GBM. (A) DWI of the brain typically performed at b-value=0, 1000s/mm2, although conspicuity of cellular dense central tumor increases at higher b-values. (B) Tissue has multiexponential diffusion decay properties as is evident by curvature in log(signal) with b-value which can be fit by a bi-exponential function to yield fast diffusion D1, slow diffusion D2 coefficients and relative fraction of fast diffusion component f. (C) The stretched exponential is an alternative functional form to fit multiexponential decay, where DDC is the distributed diffusion coefficient and a lower α value indicates greater heterogeneity of diffusion contributions in the curve. Both the bi-exponential and stretched exponential fits indicate there is a greater spread in diffusion values in tumor relative to normal grey matter for this patient.