
Figure 6.
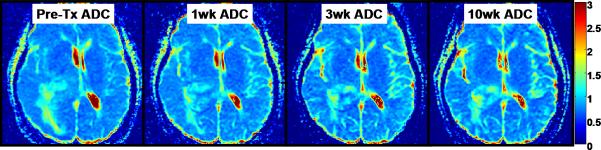
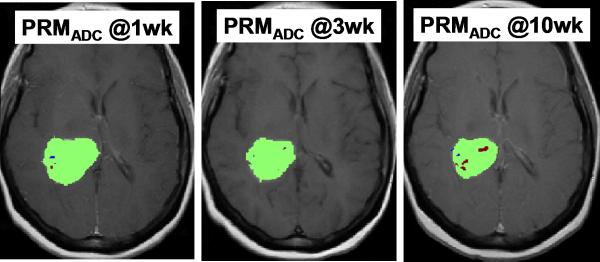
Parametric response map analysis of ADC (PRMADC) of a 53yo GBM patient. (A) Series of co-registered ADC maps one week prior to therapy; and 1, 3 and 10weeks from start of start of chemo-radiotherapy. ADC maps are on a quantitative color scale in units of 10-3mm2/s. (B) Series of PRMADC maps showing an increase in ADC beyond a +0.55×10- 3mm2/s significance threshold as red voxels; or a decrease in ADC by more than −0.55x10⁻³mm2/s as blue voxels and the remainder (non- significant change) as green voxels. These voxels are superimposed on the co-registered T1wt-gad image used to define the tumor volume of interest. PRMADC @1wk, @3wk and @10wk corresponds to ADC changes measured at 1, 3 and 10 weeks from start of therapy relative to pre-therapy baseline. This patient had a relatively small fraction of the tumor that exhibited an increase in ADC early into treatment and was considered a “non responder” by PRMADC analysis which was consistent with this patient's 7month survival. Adapted from reference 85.