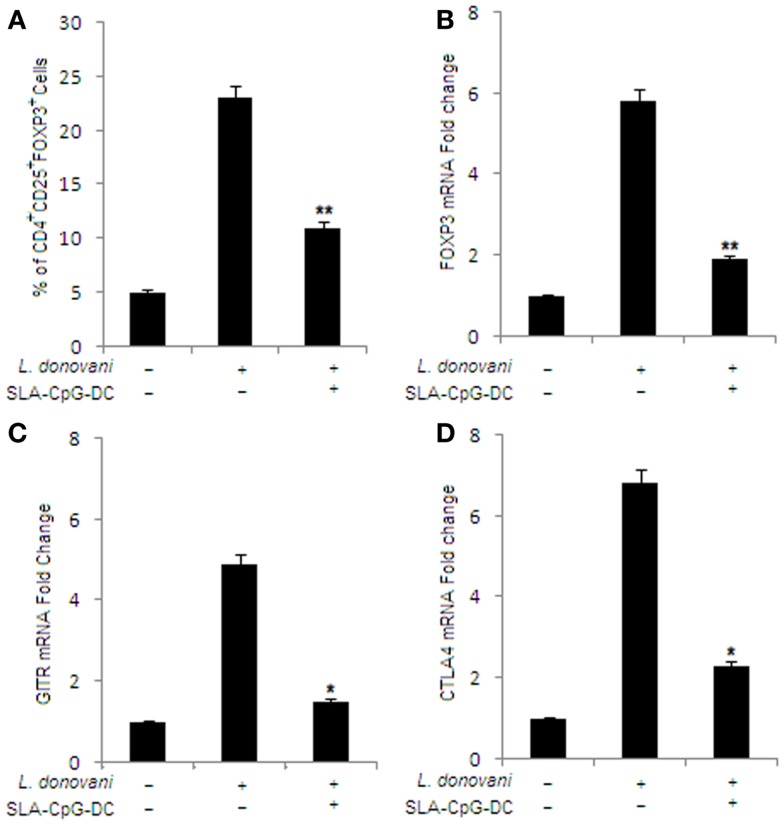
Figure 2.
Effect of SLA–CpG–DCs vaccination on the frequency and phenotype of T regulatory cells. (A) CD4+ T cells (1 × 10⁶) were purified from infected and indicated treatment groups of mice 28 days after infection, plated aseptically followed by fixation and staining for T regulatory cell-specific markers like FITC-conjugated CD25 and PE-conjugated FoxP3 mentioned in Section “Materials and Methods.” The data was analyzed by flow cytometry in each group of untreated and differently treated BALB/c mice have been presented. Data represent the mean ± SD for three animals per group. In a separate experiment, CD4+CD25+ Treg cells (2 × 10⁶) were purified from spleen of differently treated mice by MACS as described in Section “Materials and Methods.” These magnetically purified Treg cells were collected in TRIZOL for mRNA extraction and real-time PCR to study mRNA expression of T regulatory cell markers. Quantitative RT-PCR showing the expression of Foxp3 (B), GITR (C), and CTLA4 mRNA (D), where the data were presented as changes (n-fold) from uninfected control cells. *P < 0.05 and **P < 0.001, compared with T regulatory cells isolated from infected mice. The data represent the mean ± SD of data from three independent experiments, which yielded similar results.

