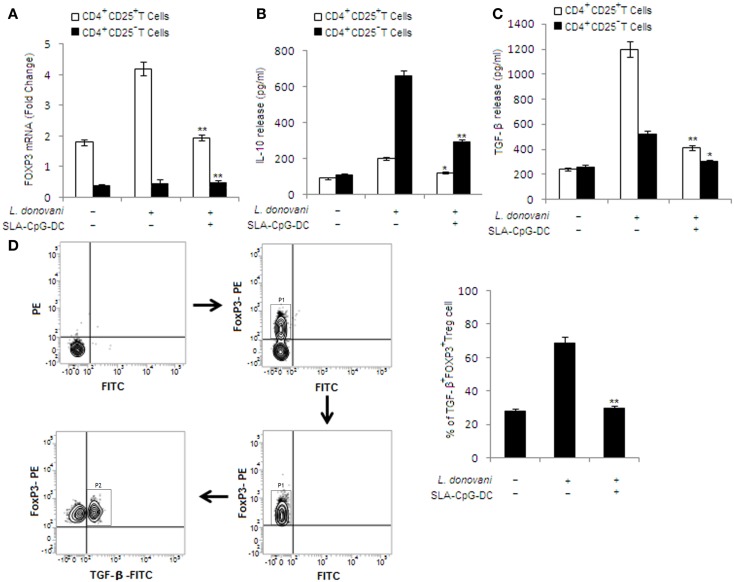
Figure 4.
Effect of SLA–CpG–DC vaccination on IL-10 and TGF-β release from T regulatory cells. (A) CD4+CD25+ Treg cells or CD4+CD25− T cells (2 × 10⁵), purified from spleen of differently treated mice (see Materials and Methods) 4 weeks post-infection, were collected in TRIZOL for mRNA extraction and real-time PCR to study Foxp3 mRNA expression or were stimulated with SLA for 72 h, after which the cell supernatants were collected for estimation of IL-10 (B) and TGF-β (C) by ELISA. All data were presented as mean ± SD of three triplicate wells. One of the three independent experiments is shown. *P < 0.001 indicates statistically significant differences compared with infected sets. In a separate experiment, CD4+CD25+ T regulatory cells (1 × 10⁶), isolated from spleen of differently treated mice (4 weeks post-infection), were assessed for TGF-β and Foxp3 (D), which was performed as mentioned in Section “Materials and Methods,” and analyzed by Flow cytometry. Magnetically purified CD4+CD25+ cells were analyzed for FoxP3-PE staining to detect FoxP3+CD4+CD25+ cells (P1 gated cell population in the sorting scheme). These FoxP3+CD4+CD25+ cells were further analyzed for TGF-β-FITC staining to detect TGF-β+ FoxP3+CD4+CD25+T cells (P2 gated cell population in the sorting scheme). The bar graphs represent the mean dot plot values based on the region encircling positive cells from three independent experiments. **P < 0.001 and *P < 0.05, compared with T regulatory cells isolated from infected mice. The data represent the mean ± SD of data from three independent experiments, which yielded similar results.

