
Figure 3. RAGE is dispensable for the differentiation and suppressor activity of MDSC.
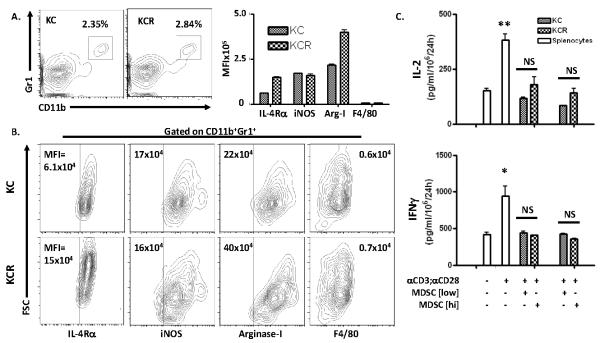
(A) Representative flow cytometry diagrams of splenocytes from 20 week old KC (n=2) and KCR (n=2) mice stained for co-surface expression of MDSC markers CD11b and Gr1. (A, B) Flow diagrams of splenocytes gated for CD11b and Gr1 positivity and stained for surface expression of IL-4Rα and F4/80, and intracellular expression of iNOS/NOS type II and arginase-I from KC and KCR mice. (A) Graphical representation of the MFIs of each marker (+/− SD). (B) MFI values illustrated on diagrams. Demarcations based on isotype controls (data not shown). (C) MDSCs from mice in panels A and B were magnetically separated and co-cultured with bulk wild-type splenocytes stimulated with αCD3/αCD28 activator beads at rations of 1:1 (MDSC [low]) and 2:1 (MDSC [hi]). Graphs depict IL-2 and IFNγ levels detected in the resultant supernatants by ELISA (+/− SEM, *p<0.05, **p<0.01, NS = not significant).