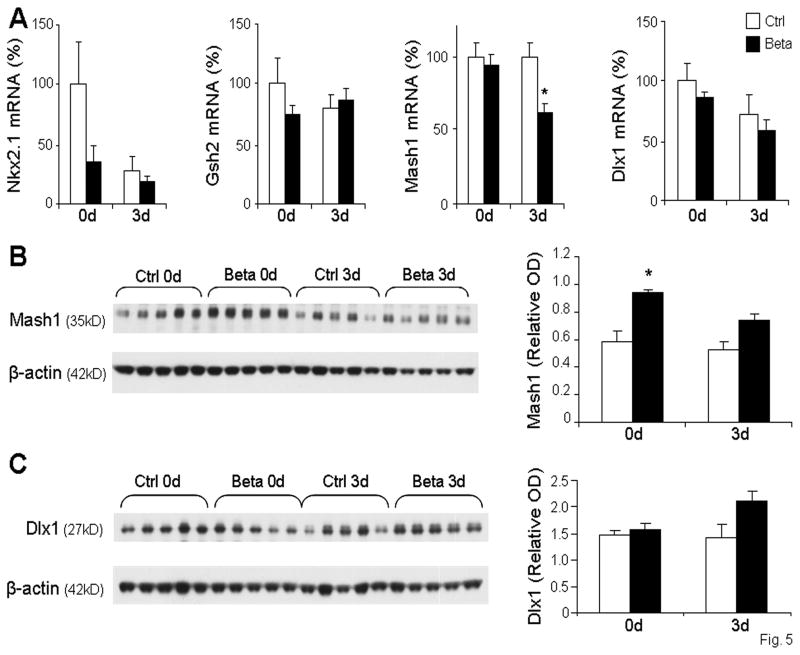
Fig. 5. Prenatal betamethasone transiently increases Mash1 protein levels, but does not affect other transcription factors regulating GABAergic neurogenesis.
mRNA levels of transcription factors were measured by qRT-PCR in betamethasone treated pups (Beta) and untreated controls (Ctrl) at 0d and 3d. Bar graphs show mean ± SEM (n=6 each group). Nkx2.1, Gsh2, and Dlx1 gene expression were comparable between treated groups and controls. However, Mash1 mRNA accumulation was decreased in betamethasone treated pups compared to controls at 3d, but not at 0d. B. Representative Western blot for Mash1, normalized to β-actin, shows an increase in protein in betamethasone treated pups versus controls at 0d, but not 3d. Bar graphs show mean ± SEM (n=5 each group). C. Representative Western blot for Dlx1, normalized to β-actin. Bar graphs show mean ± SEM (n=5 each group). *P<0.05, betamethasone treated pups vs. untreated controls.

