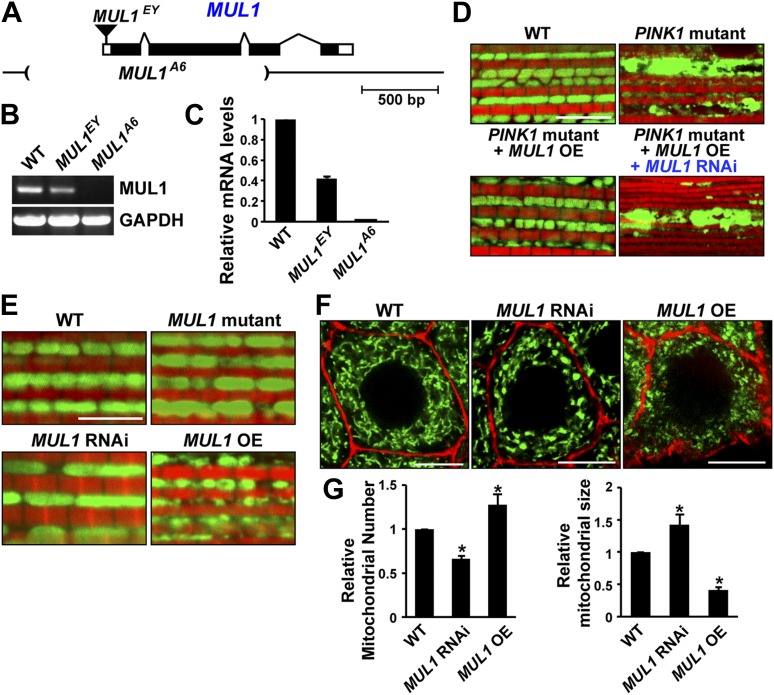
Figure 2. MUL1 regulates mitochondrial morphology.
(A) A schematic depicting the Drosophila MUL1 genomic region (cytological location 64A4). MUL1 coding and untranslated regions (dark and open rectangles, respectively) are depicted. The P element, MUL1EY, inserted in the 5′ UTR, is shown as an inverted triangle. The deleted region in the MUL1A6 allele is indicated by parentheses. (B) RT PCR shows that flies carrying the MUL1EY allele have detectable but reduced levels of MUL1 transcripts. However, no MUL1 transcript is detected in flies homozygous for the MUL1 deletion, MUL1A6. (C) qPCR shows that MUL1EY allele has approximately a 60% reduction of MUL1 transcript compared to the wild-type (WT). No MUL1 transcript is detected in flies homozygous for MUL1A6. (D) MUL1 RNAi line reverses the suppression of PINK1 mutant mitochondrial phenotypes due to MUL1 overexpression. (E) Muscle fibers stained with mitoGFP in green and actin in red. Compared with the WT, flies homozygous for the MUL1 deletion or expressing MUL1 RNAi show slightly elongated mitochondria. In contrast, when MUL1 is overexpressed using the Mef2-Gal4 driver, mitochondria are significantly smaller. (F) Salivary glands, with cell boundaries labeled with rhodamine phalloidin in red, and mitoGFP in green. In WT, mitochondria are tubular and evenly distributed. In contrast, in cells expressing MUL1 RNAi (driven by OK6-Gal4) mitochondria are fewer in number and found in clumps. In contrast, MUL1 overexpression (also driven by OK6-Gal4) results in fragmented mitochondria and irregular cell boundaries. (G) Quantification of mitochondrial number and size in salivary glands (mean ± SEM, n > 6 larvae for each genotype). * Significantly different from wild-type, p<0.05 (One-way ANOVA with Tukey's multiple comparisons test).

