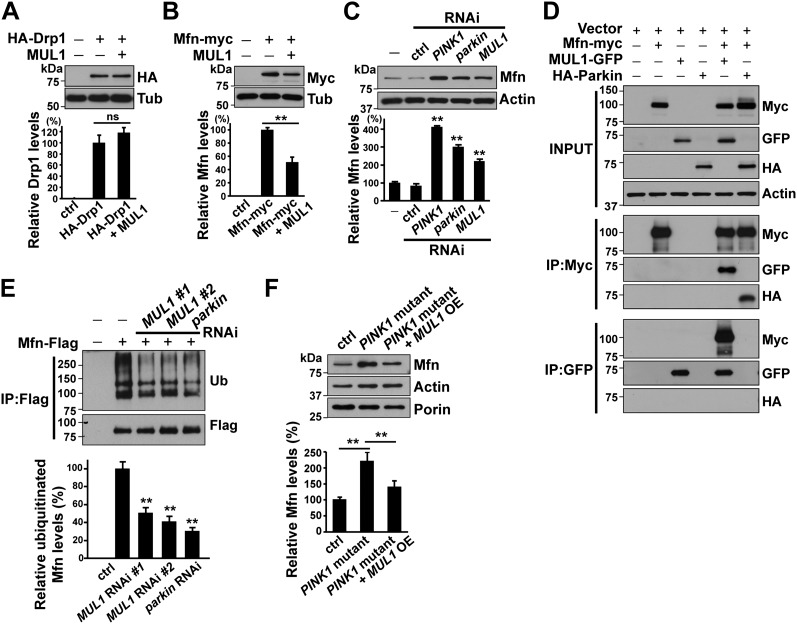
Figure 3. MUL1 physically binds to Mfn, and promotes ubiquitination-mediated Mfn degradation.
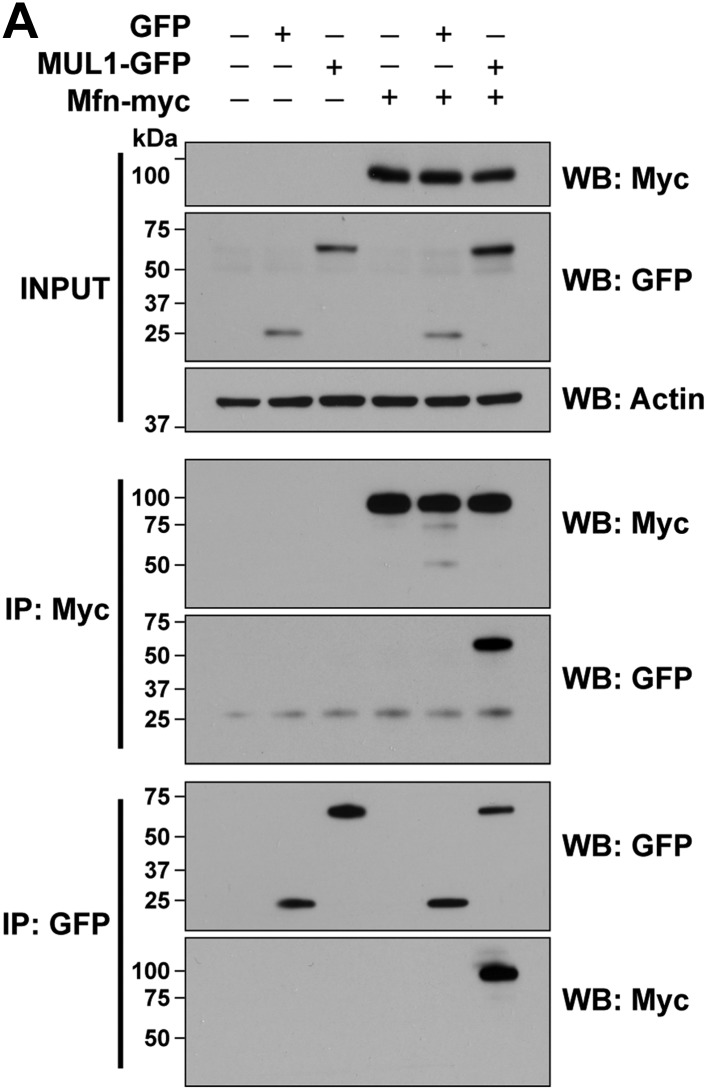
(A and B) Western blots and quantifications of Drp1 and Mfn levels in vivo. Analysis of lysates from thoraces show that MUL1 overexpression reduces Mfn levels (B) but not Drp1 levels (A). The data are shown as the mean ± SEM from three experiments (each experiment was done with lysate from 8 thoraces for each genotype). The statistical analysis was done using One-way ANOVA with Tukey's multiple comparisons test. ns: not statistically significant. ** Significantly different, p<0.01. (C) Western blots of Mfn levels in S2 cells either not treated or treated with control, PINK1, parkin or MUL1 RNAi. Quantification of relative Mfn levels shows that there is an increase in Mfn levels in cells treated with RNAi to PINK1, parkin, or MUL1 (mean ± SEM, ** Significantly different from cells not treated with RNAi, p<0.01, One-way ANOVA with Tukey's multiple comparisons test). (D) Co-immunoprecipitation using lysates from S2 cells transfected with the indicated constructs. The INPUT represents 2% of total lysate to monitor protein expression (top panel). MUL1-GFP is co-immunoprecipitated with Mfn-myc using both anti-GFP and anti-Myc antibodies. Mfn-myc also co-immunoprecipitates with HA-Parkin, which serves as a positive control. The interaction between Mfn-Myc and MUL1-GFP was specific, as confirmed by separate immunoprecipitation control experiments (Figure 3—figure supplement 1). (E) Mfn ubiquitination levels in S2 cells. S2 cells are treated with dsRNA designed to silence various genes and transfected with Mfn-Flag. Immunoprecipitation was performed with anti-Flag antibody, and Western blots were probed with anti-Ubiquitin antibody and an anti-Flag antibody. Relative ubiquitination levels compared to control are shown below (mean ± SEM). ** Significantly different from control, p<0.01 (One-way ANOVA with Tukey's multiple comparisons test). In S2 cells, Mfn is highly ubiquitinated. RNAi of MUL1 or parkin results in reduced levels of ubiquitnated Mfn. Two independent MUL1 RNAs are utilized to knockdown MUL1, which yield the same results. (F) In PINK1 mutant thoraces, where Mfn levels are increased, MUL1 overexpression (driven by Mef2-Gal4) reduces the increased Mfn levels. Relative Mfn levels compared to control are shown below (mean ± SEM). ** Significantly different, p<0.01 (One-way ANOVA with Tukey's multiple comparisons test).


