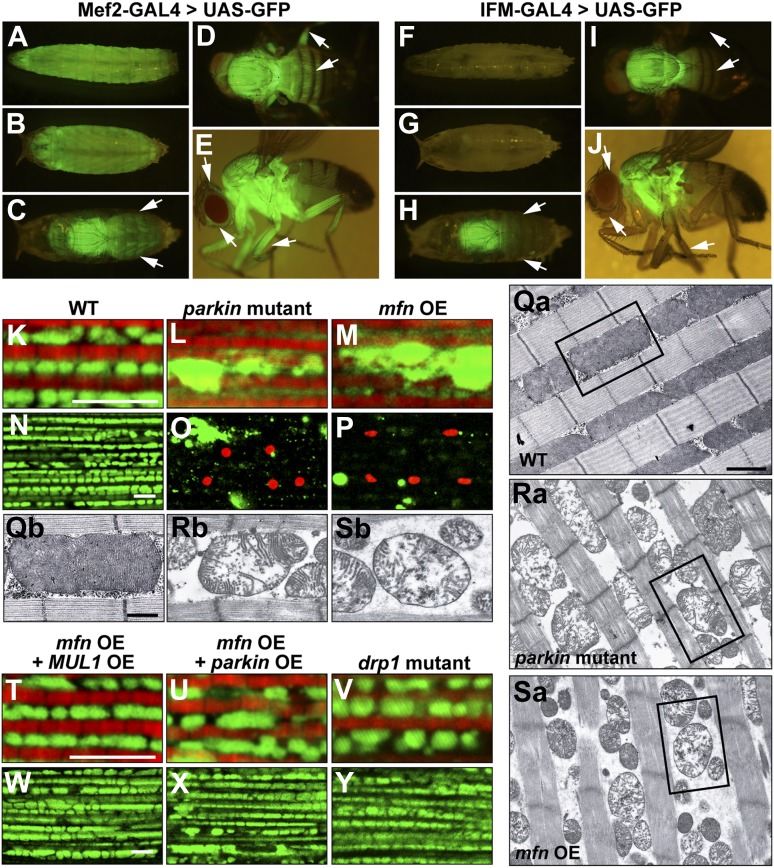
Figure 4. Generation and expression of the IFM-GAL driver; mfn overexpression, but not loss of drp1, induces PINK1/parkin-mutant like pathology.
(A–J) Different developmental stages of flies expressing GFP under Mef2-Gal4 (A–E) or IFM-Gal4 (F–J). (A) Third instar larvae show GFP expression in whole body muscles. (B) At the early pupal stage, GFP is expressed in a similar pattern as in larvae. However, the GFP expression pattern become more specific at the late pupal stage (C), in which the strongest GFP signal is seen in the thorax, and a weaker signal is observed in the head and abdomen (arrows). (D) In an adult fly, dorsal view shows GFP signal in the thorax, upper abdomen and legs. (E) GFP is also expressed in adult head and legs, marked with arrows. (F) Flies expressing GFP under IFM-Gal4 show no GFP expression in third instar larvae, or in early pupae (G). (H) GFP is strongly expressed only in the thorax at the late pupal stage, but not in other areas (arrows). (I) In the adult fly, GFP signal is highly concentrated in the thorax. No GFP expression in abdomen and legs is observed, arrows. (J) In contrast to GFP expression under Mef2-Gal4, IFM-Gal4 does not express in adult head or legs, as indicated with arrows. (K–P, T–Y) Confocal images of muscle double labeled with mitoGFP (green) and phalloidine (red) (K–M, T–V), or those labeled with mitoGFP and TUNEL (red) at lower magnification (N–P, W–Y), respectively. (Qa–Sb) EM images of mitochondria in muscle. Single mitochondrion from the black-boxed area in Qa, Ra, Sa is shown in Qb, Rb, Sb. Scale bars: 1 µm (Qa, Ra, Sa) and 0.5 µm (Qb, Rb, Sb). Compared with wild-type (K and N), parkin null mutant (L and O) shows overall reduced levels of mitoGFP signal, large mitochondrial clumps, and muscle cell death. Similar phenotypes are observed with mfn overexpression (M and P), and these phenotypes are suppressed by MUL1 overexpression (T and W). As a control, parkin overexpression also suppresses phenotypes due to mfn overexpression (U and X). Importantly, drp1 null (drp11/drp12) mutant muscle does not have any mitochondrial clumping or TUNEL-positivity seen in loss of parkin function or mfn overexpression (V and Y). mfn overexpression is driven by IFM-Gal4. Scale bars: 5 µm.

