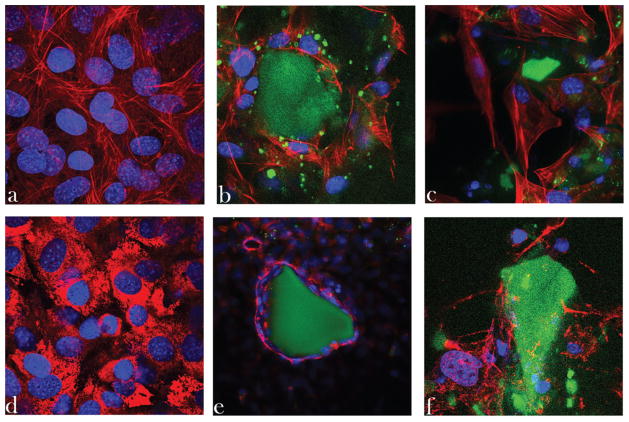
Figure 7.
Single-plane confocal optical micrographs of fluorescently stained osteoblastic MC3T3-E1 cells [cytoskeletal f-actin (a–c) or type I collagen (d–f)—red; nucleus—blue] of the control sample (a and d) and of those incubated with HAp nanoparticles (b and e) and HAp/chitosan composites (c and f) (both green), following 5 days of incubation. The sizes of the images are 270 × 270 μm2 (a–d and f) or 450 × 450 μm2 (e).

