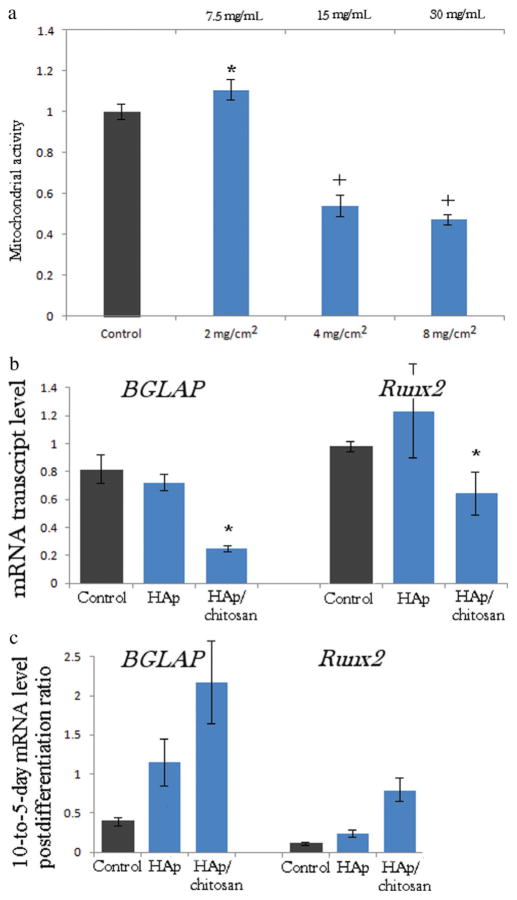
Figure 8.
(a) Mitochondrial dehydrogenase activity indicative of cell viability normalized to the negative control (C−) and determined by the MTT assay after 96 h of incubation with different HAp/chitosan particle concentrations normalized to surface area of confluent MC3T3-E1 osteoblastic cells (mg/cm2) and to the volume of the cell culture medium (mg/mL). Data normalized to the optical density at λ = 570 nm of the negative control are shown as arithmetic means with error bars representing SD. Samples with significantly (p < 0.05 with respect to the control group) higher cell viability with respect to the control are marked with a*, whereas those with significantly lower cell viability are marked with a+. (b) The comparative effect of HAp and HAp/chitosan nanoparticulate powders on the mRNA expression of osteogenic markers BGLAP and Runx2 in osteoblastic MC3T3-E1 cells. mRNA expression was detected by quantitative real-time PCR relative to the housekeeping gene ACTB. Data normalized to expression of ACTB are shown as averages with error bars representing SD. Genes significantly (p < 0.05) downregulated with respect to the control group are marked with *. (c) 10-to-5-day postdifferentiation ratio in the mRNA expression level detected by quantitative real-time PCR relative to the housekeeping gene ACTB. All data groups are significantly different (p < 0.05) from the control.

