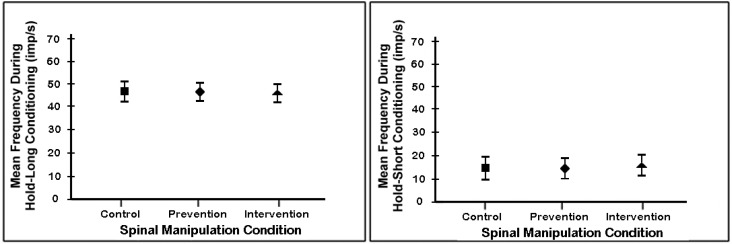
Figure 2.
Mean discharge frequency of paraspinal muscle spindles for each of the 3 spinal manipulation conditions during the conditioning phase used to create muscle history. Conditioning phase identified graphically in left panel of figure 1. Each symbol represents the mean ± 95% confidence interval of 28 spindles.

