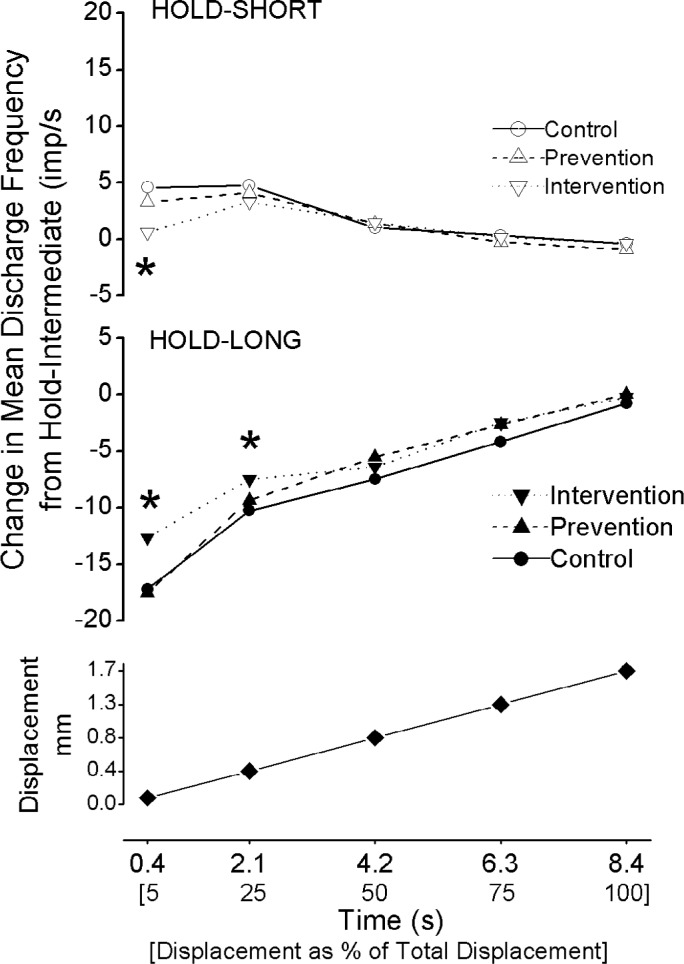
Figure 5.
Time course of changes in muscle spindle discharge during the dynamic test for hold-short compared with hold-intermediate (upper panel) and for hold-long compared with hold-intermediate (middle panel). Bottom panel shows the magnitude of the vertebral movement over which the dynamic test was analyzed. * p<0.05 compared with the spinal manipulation control condition. Each symbol represents the average value between its time position and the time position of the previous data point, except for 5% which represents the average value between its time position and time 0 s.

