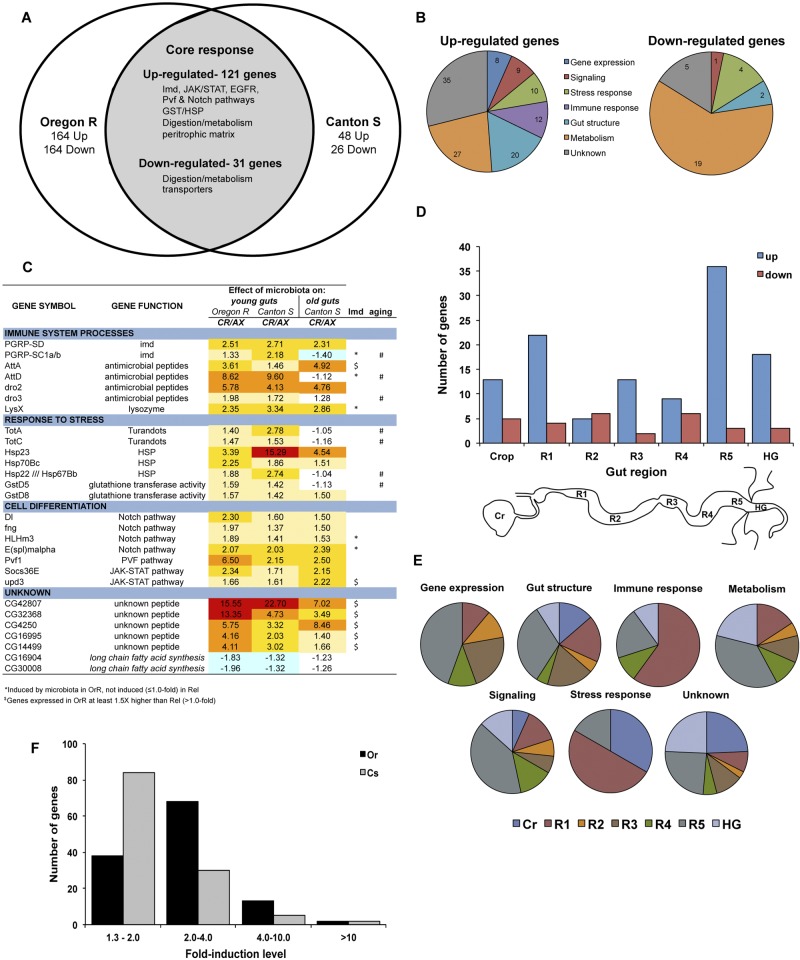
FIG 2 .
Impact of microbiota on host gene expression in the gut. (A) Venn diagram depicting the core set of genes whose expression was altered in the gut of wild-type flies by microbiota. Two laboratory-derived wild-type populations were compared (OregonR and CantonS). The number of altered genes specific to each strain is indicated, and highlighted pathways and genes of the core response are listed. (B) Proportion of upregulated (top) and downregulated (bottom) genes in each of six gene ontology categories or unknowns. The total gene number in each category is indicated in its respective section. (C) Highlight of core genes altered in the gut of young flies by microbiota. Across the different gene ontology categories, our microarray showed that microbiota were important basal inducers of immune and homeostatic pathways in the gut. Fold changes in expression for each wild-type condition tested (OregonR young, CantonS young, and CantonS old) are shown. In addition, genes whose expression was impacted in young immune-deficient (RelishE20) flies (“*” denotes Imd-regulated genes; “$” indicates Imd-altered genes) or displayed abnormal regulation with aging (#) are indicated. CR, conventionally reared; AX, axenically reared. (D) Distribution of the core set of upregulated (blue) and downregulated (red) genes in different regions of the gut. Classification for the gut regions was made based on their enrichment per the classification given elsewhere (21). The number of genes enriched in the crop, regions 1 to 5 of the midgut (R1 to R5), or the hindgut (HG) are shown (the scheme of gut regions is depicted below). (E) The proportion of microbiota-induced genes in each gene ontology category per region (see panel D) is shown. (F) Distribution of the core set of microbiota-induced genes based on their fold change in OregonR (black) and CantonS (gray) flies.

