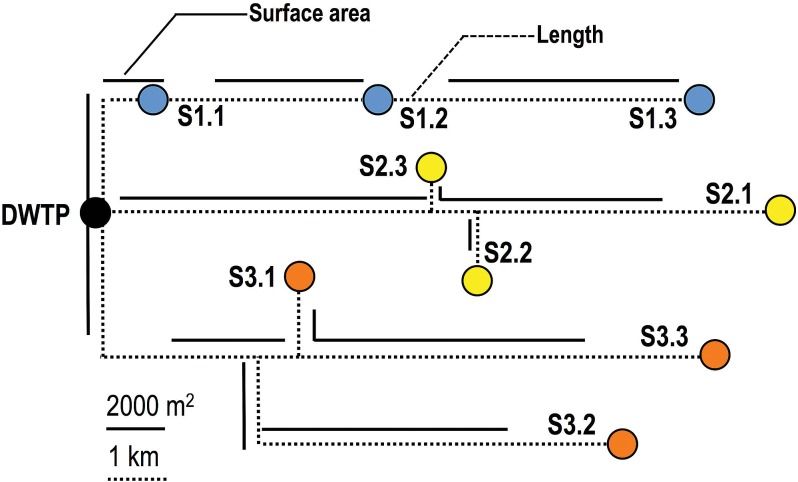
FIG 1 .
Schematic showing the sampling points at the DWTP (black circle) and in the three sectors of the DWDS (blue circles, sector 1; yellow circles, sector 2; orange circles, sector 3) included in this study and the layout of the pipe network connecting them. Dashed lines are scaled to the pipe lengths, and bold lines are scaled to the pipe surface area between any two sampling points. Scale bars for pipe length and surface area are shown at the bottom of the figure. Sampling points in sector 1 are located along a linear flow path, while sectors 2 and 3 have two and three branches, respectively.

