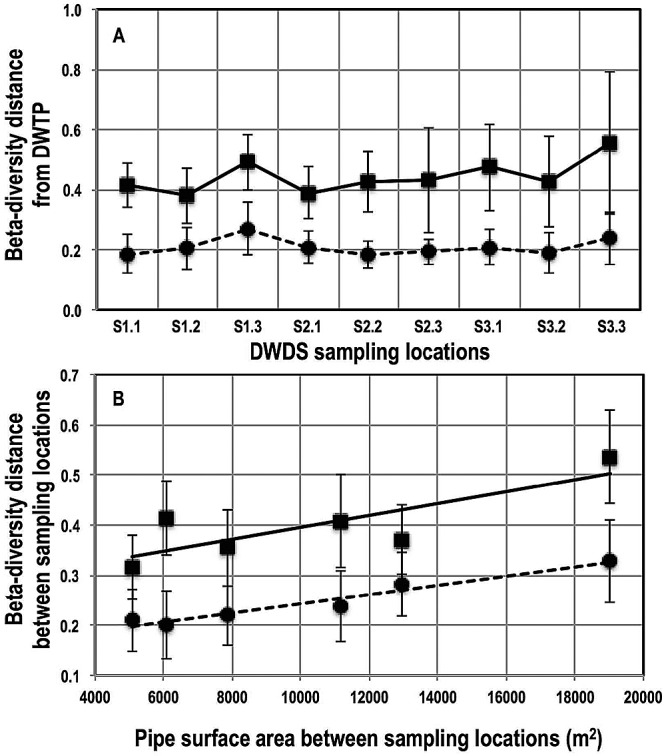
FIG 4 .

(A) Bray-Curtis distances (black squares) and weighted UniFrac distances (black circles) of the DWDS sampling locations (x axis) from the reservoir at the DWTP averaged over the duration of the study. (B) Correlations between Bray-Curtis distances (black squares) and weighted UniFrac distances (black circles) of bacterial communities sampled at any two locations in sector 1 and the pipe surface area connecting them. Error bars for both plots show variability over the 15-month sampling campaign in the respective beta diversity metric.
