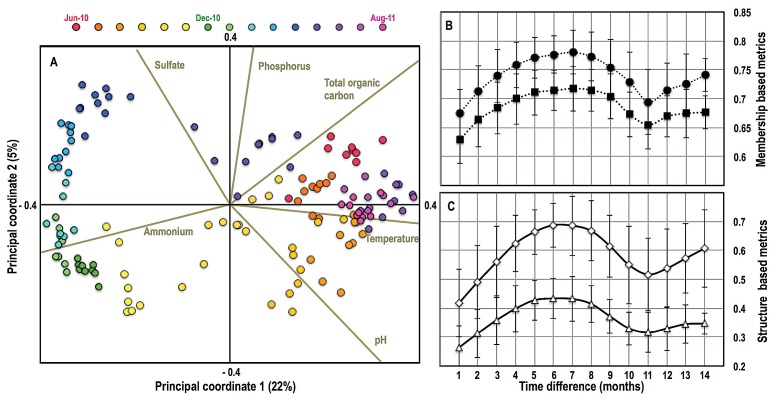
FIG 5 .
(A) Principal-coordinate biplot showing the temporal variability of the bacterial community structure constructed using the Bray-Curtis distance metric. Data points are colored by month, and the legend is provided above the plot. Environmental and process parameters, with significant Pearson’s correlation (P < 0.000001) with either of the two principal axes, are shown here. Beta diversity distance between samples as a function of time difference (months) between them using membership-based (Jaccard [black circles]; unweighted UniFrac [black squares]) (B) and structure-based (Bray-Curtis [open diamonds]; weighted UniFrac [open triangles]) (C) metrics. Error bars in panels B and C indicate variability in beta diversity distance for sample comparisons for each time difference.

