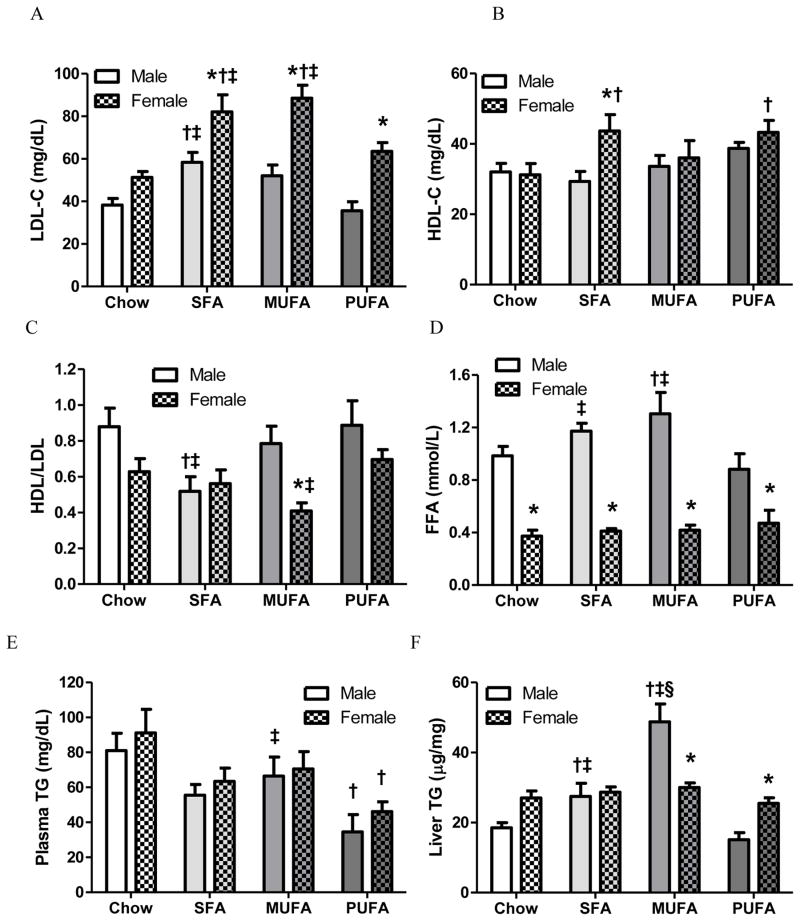
Figure 2. Lipid analysis of plasma samples from the hepatic portal vein and liver lipid content of male and female mice.
Plasma lipid levels, including LDL-cholesterol (LDL-C; A), HDL-cholesterol (HDL-C; B), HDL/LDL ratio (C), free fatty acid (FFA; D), triglyceride (TG; E), and liver TG content (F) were analyzed by a two-way ANOVA (sex x diet) followed by Bonferroni posttest. *: Significantly different between sexes. †: Significantly different comparing to the same sex chow group. ‡: Significantly different comparing to the same sex PUFA group. §: Significantly different comparing to the same sex SFA group.

