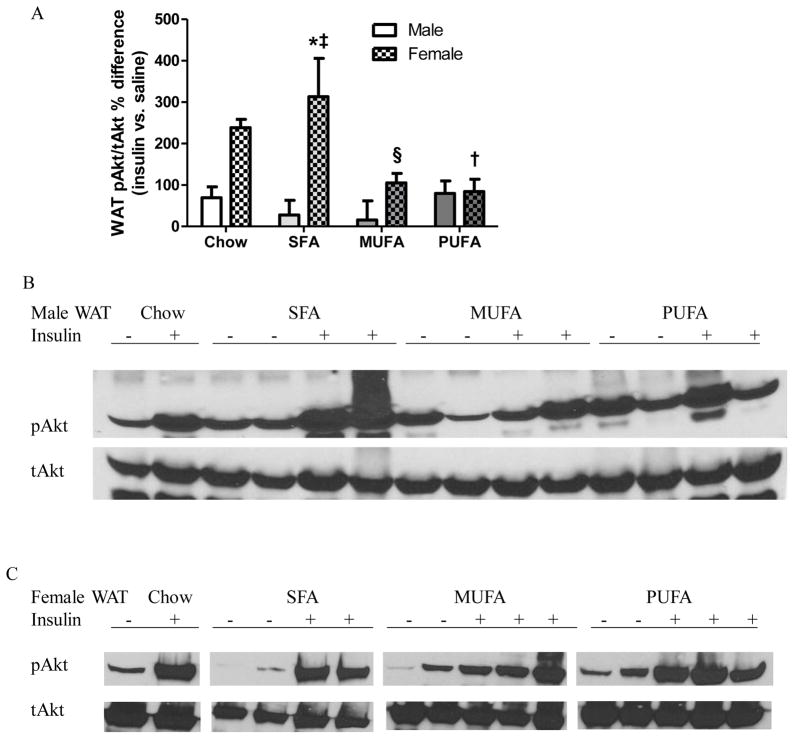
Figure 3. Analysis of Akt activation in adipose tissue of male and female mice.
A: Percentage differences in pAkt/tAkt ratio at white adipose tissue (WAT) of insulin- vs. saline-treated mice.
% difference = (pAkt/tAkt [insulin] - pAkt/tAkt [saline]) / average pAkt/tAkt [saline] x 100%; pAkt/tAkt [saline]: pAkt/tAkt of each saline-injected animal; pAkt/tAkt [insulin]: pAkt/tAkt of each insulin-injected animal; average pAkt/tAkt [saline]: average of pAkt/tAkt of all saline-injected animals from a group.
Two-way ANOVA (sex x diet) followed by Bonferroni posttest was performed. *: Significantly different between sexes. †: Significantly different comparing to the same sex chow group. ‡: Significantly different comparing to the same sex PUFA group. B-C: Western blot analysis of pAkt and tAkt expression in WAT of males (B) and females (C). Representative data from one experiment shown.

