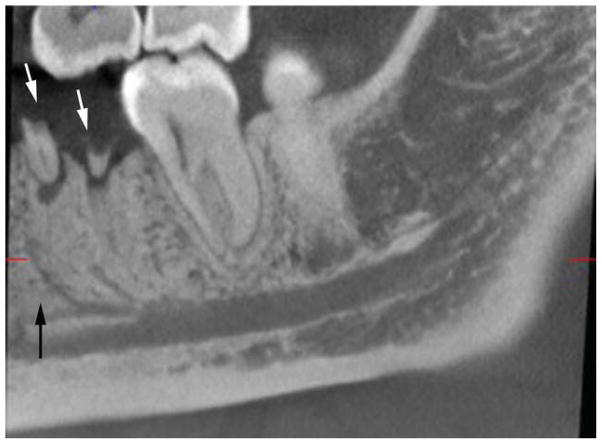
Figure 3.
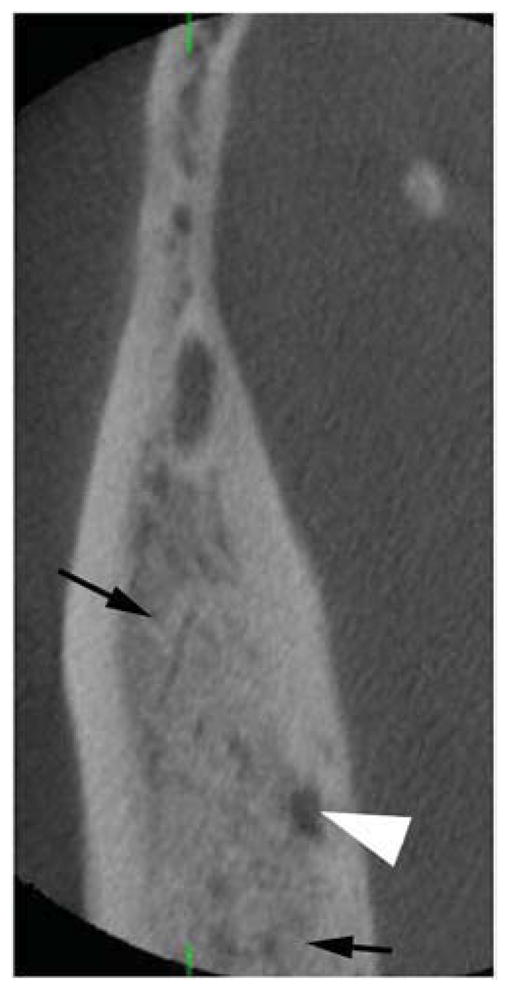
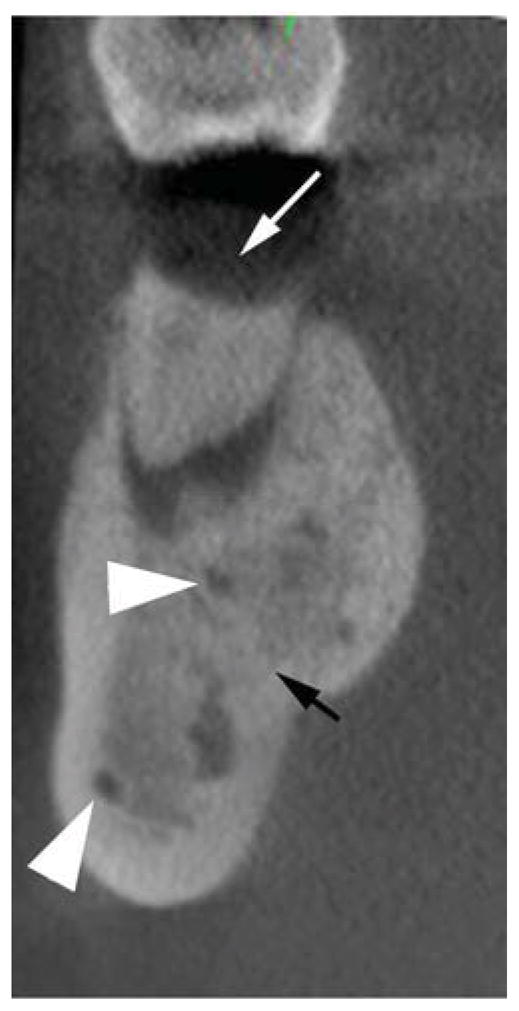
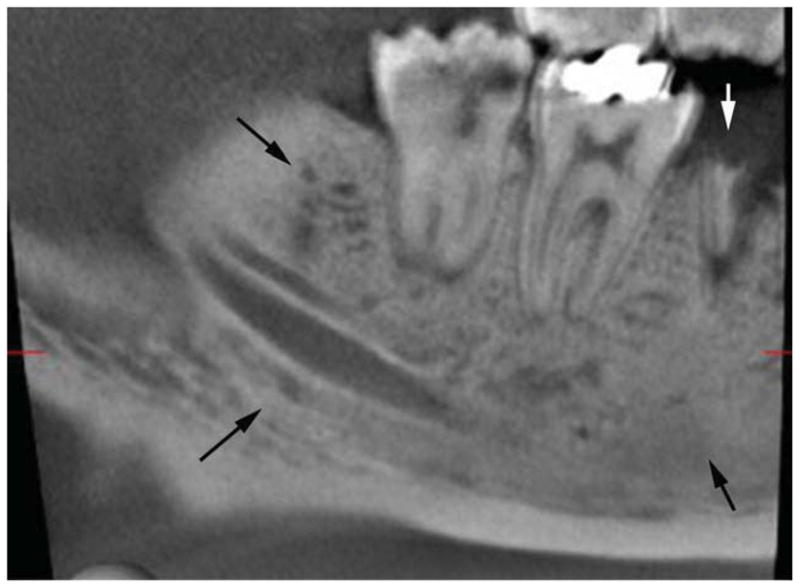
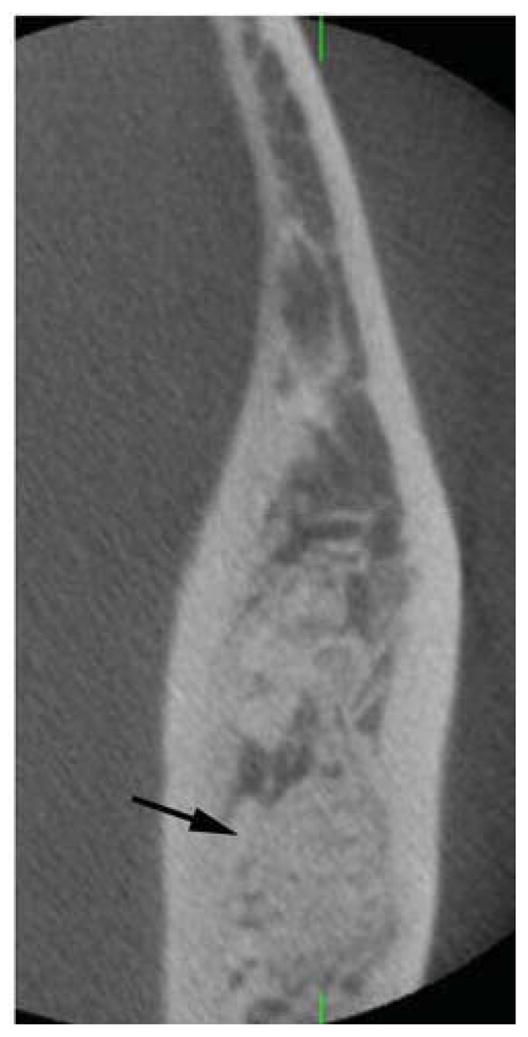
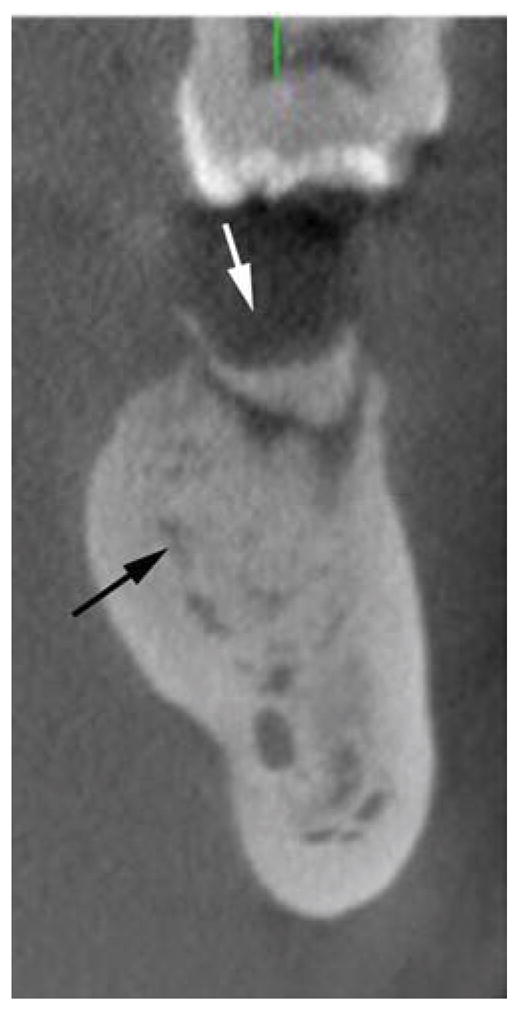
Axial (A, D), cross-sectional (B, E) and sagittal (C, F) cone beam CT (CBCT) slices of the patient’s right (A, B, C) and left (D, E, F) posterior mandible. White arrows point to root fragments, black arrows to areas of increased trabecular density and loss of trabecular architecture, and white arrowhead to radiolucent areas.

