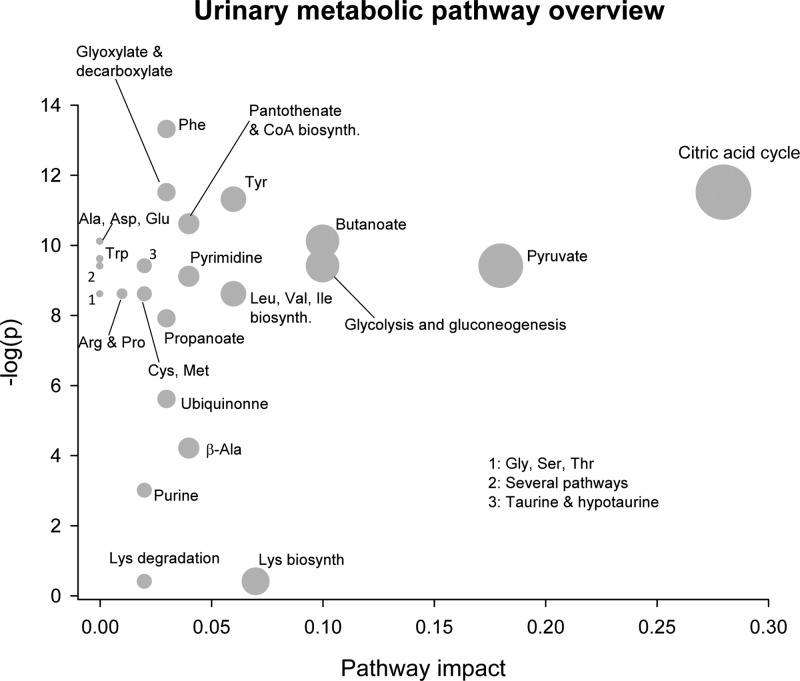
Figure 3.
Urinary pathway overview of the explorative LC–MC analysis from mice fed HF casein or HF whey diets. Explorative LC–MS analysis was performed on urine sampled for 48 h from mice fed HF casein or HF whey diets (n = 8/diet). By use of the software Metaboanalyst 2.0, the urinary metabolome was matched with metabolic pathways. The metabolome view above shows matched pathways according to p values (y axis) from pathway enrichment analysis and pathway impact values (x axis) from pathway topology analysis. The TCA cycle pathway identified in the upper right corner is of greater importance for the separation of the urine metabolome between treatments.

