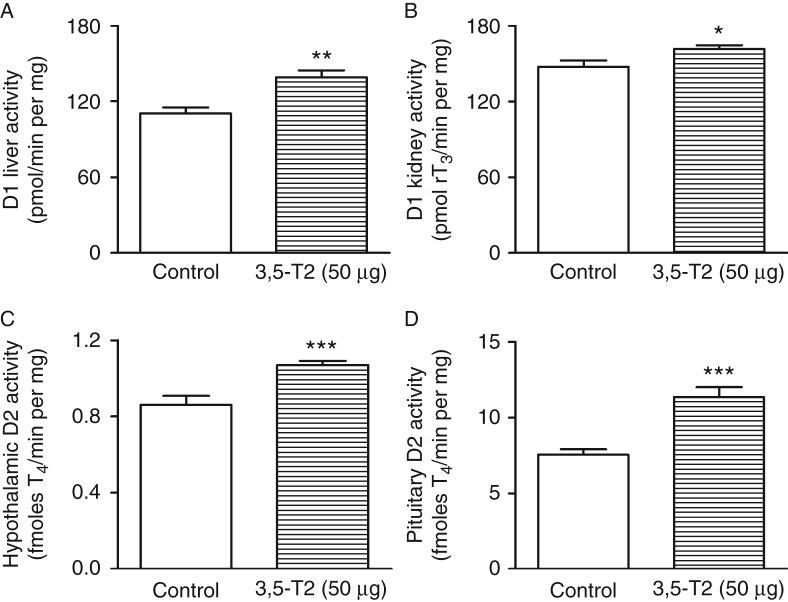
Figure 4.
Type 1 (D1) and type 2 (D2) iodothyronine deiodinase activities in control rats and rats treated with 3,5-diiodothyronine (3,5-T2) for 90 days at a dose of 50 μg/100 g BW. (A) Hepatic D1 (control, n=12; 3,5-T2, n=17); (B) kidney D1 (control, n=8; 3,5-T2, n=12); (C) hypothalamic D2 (control, n=8; 3,5-T2, n=11); and (D) pituitary D2 (control, n=15; 3,5-T2, n=20) activities. The results are expressed as the mean±s.e.m. The data were analyzed by the unpaired t-test. *P<0.05 vs control group; **P<0.005 vs control group; ***P<0.0005 vs control group.

 This work is licensed under a