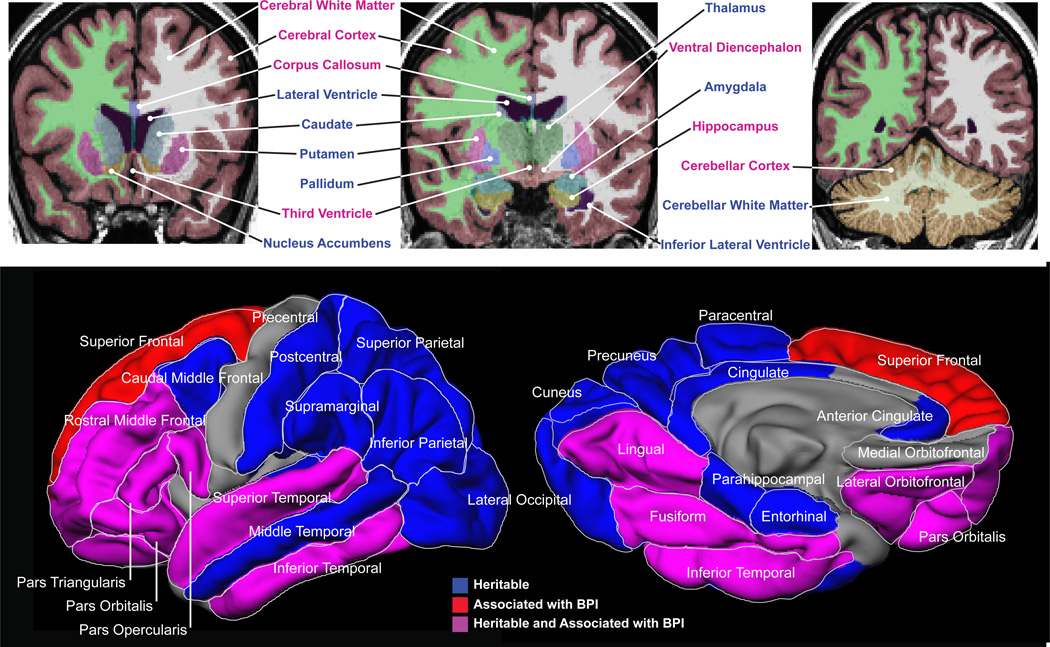
Figure 2. Structural neuroimaging phenotypes.
Upper panel shows results of the heritability and BP-I association analyses of volumetric MRI phenotypes. The three representative T1-weighted MRI coronal images depict the results of the Freesurfer segmentation overlaid as colored masks selected to better distinguish the anatomy. Mask colors are not related to the results. The colors of the text labels indicate structures that showed significant evidence of familial aggregation (blue) and structures that were both heritable and associated with BP-I (magenta).
Lower panel depicts cortical thickness phenotypes and shows the results of the heritability and BP-I association analysis for cortical gray matter thickness. Heritable cortical regions are colored in blue, BP-I-associated regions are shown in red and regions that were both heritable and associated with BP-I are colored in magenta. The medial surface is rotated upwards by 60° to provide a view of the ventral surface.

