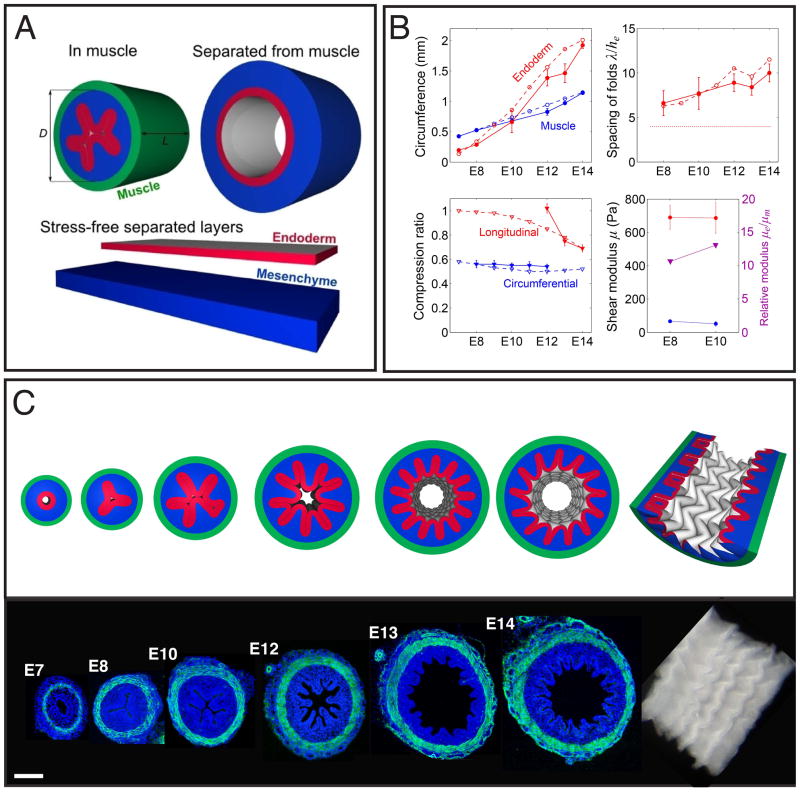
Figure 4. A numerical simulation predicts the formation of ridges and zigzags in chick gut lumen.
(A) The model is illustrated by showing the mesenchyme (blue) and endoderm (red) enclosed in a muscle (green), without muscle, and separated in their stress-free states. (B) Upper left - Circumference of the inner boundary of the muscle and endoderm. Upper right - Spacing of longitudinal folds measured along the endoderm and scaled by its thickness. The thin dashed line is the stress-free thickness of the endoderm-mesenchyme composite. Lower left - Ratio of muscle to separated endoderm-mesenchyme composite in circumferential and longitudinal directions. Lower right - Shear modulus of mesenchyme and endoderm, and their ratio. In all panels solid lines correspond to experimental observations and dashed lines to the computational model. (C) A simulation shows ridge-folds forming due to circumferential compression, followed by buckling into a zigzag pattern due to longitudinal compression. Sections of corresponding chick guts labeled with DAPI (blue) and SMA (green) are shown below.

