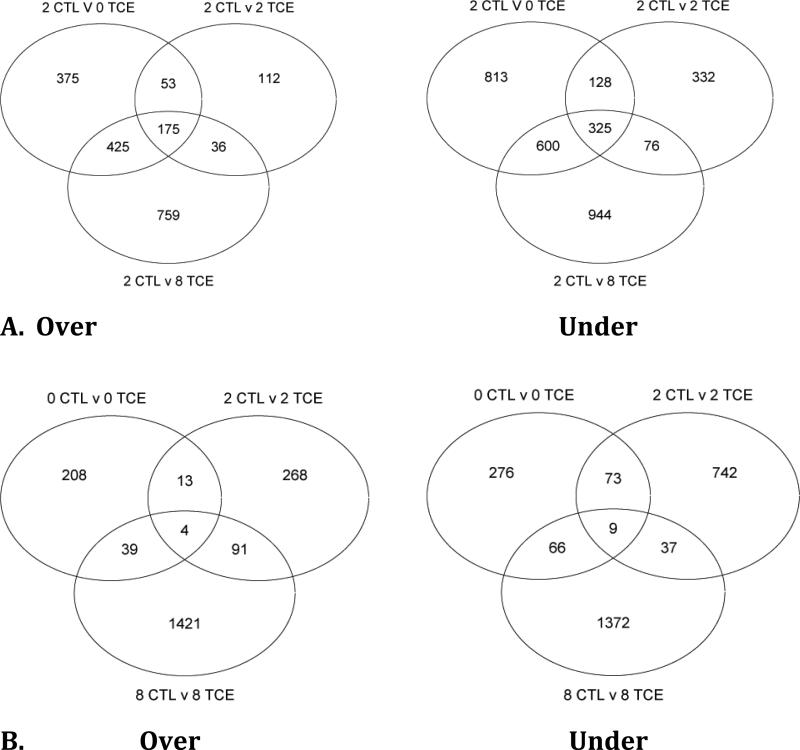
Figure 2. Venn Diagrams.
Overview of all genes altered in day 10 embryonic cardiac tissue microarrays. A) Shows comparisons between the 2mg/kg control group (2CTL) against all TCE-treated groups (OTCE, 2TCE, 8TCE). 2CTL v 0 (2, or 8) TCE include transcripts that were either under or over expressed in the TCE groups when compared with the control, 2CTL group. B) Shows comparisons between each individual TCE exposed group (OTCE, 2TCE, 8TCE) against their own folate level control group (OCTL, 2CTL, 8C).

