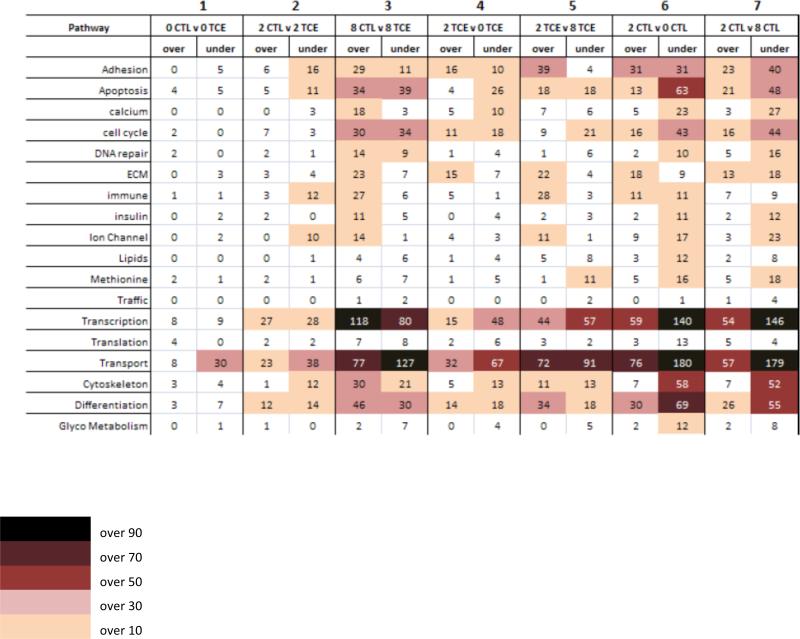
Figure 3. Overall gene expression changes.
Numbers in each box represent genes over- or under-expressed in each one of the six comparison group, and assigned to specific Kegg pathways. In the first 3 columns, expression level of transcripts in the TCE exposed embryos at low, normal, and high folate were compared against non-exposed embryos at the same folate level. Columns four and five evaluate changes in the TCE exposed embryos at 0 and 8mg/kg folate level compared against the 2mg/kg folate level exposed to 10ppb TCE. Columns six and seven indicate the number of transcripts altered in the 0 and 8mg/kg folate controls compared against 2mg/kg folate control embryos, therefore account for folate-induced changes only.

