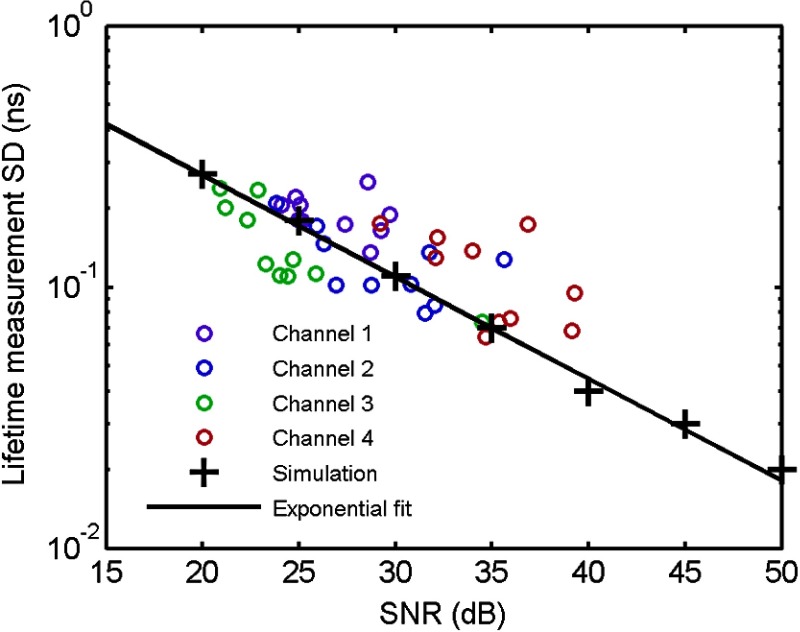
Fig. 4.
Theoretical and experimental correlation of signal-to-noise ratio (SNR) and lifetime measurement standard deviation (SD). Ex vivo coronary artery average lifetime images (Fig. 7(d)) were manually segmented to select regions of interest (ROIs) for each channel in which the average SNR and lifetime SD is calculated and plotted as scatter plot. Lifetime estimation SD of simulated data generated by random multiexponential decay model with different levels of Gaussain white noise (black cross) was fitted to an exponential function of SNR (black solid line) and agreed with the experimental data.

