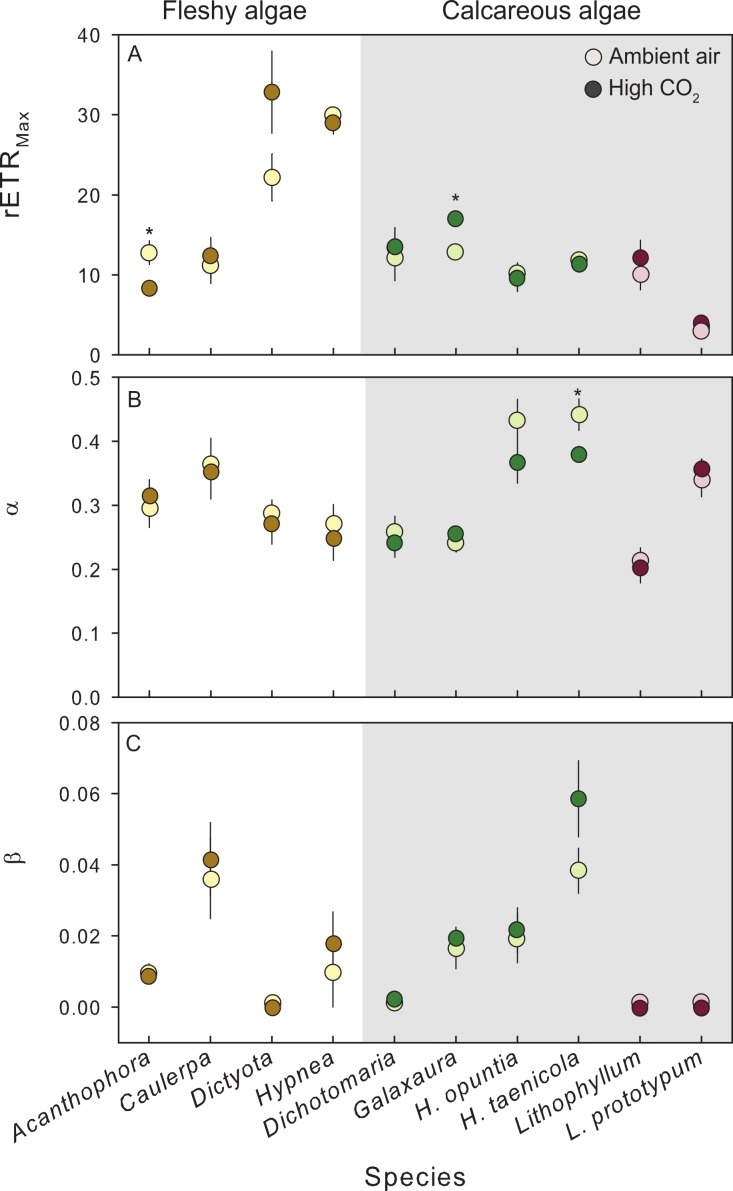
Figure 3. Photosynthetic response of fleshy and calcareous algae to treatment conditions.
The mean (±SE) photosynthetic parameters from RLCs following exposure to either present-day ambient air controls (open circles) or predicted OA treatments (closed circles). Species tested in multiple experiments were pooled across years. RLCs were measured fluorometrically with a pulse amplitude modulated fluorometer (PAM), and fit to the model of Platt, Gallegos & Harrison (1980). From the model we derived (A) maximum photosynthetic performance (rETRMax), (B) photosynthetic efficiency (α), and (C) photoinhibition (β). Parameters from replicate RLCs were averaged for each individual. Fleshy macroalgae are shown in brown, upright calcareous algae in green, and CCA in red. * Indicates a significant difference between treatments as determined by independent t-tests (results reported in Table 2).

