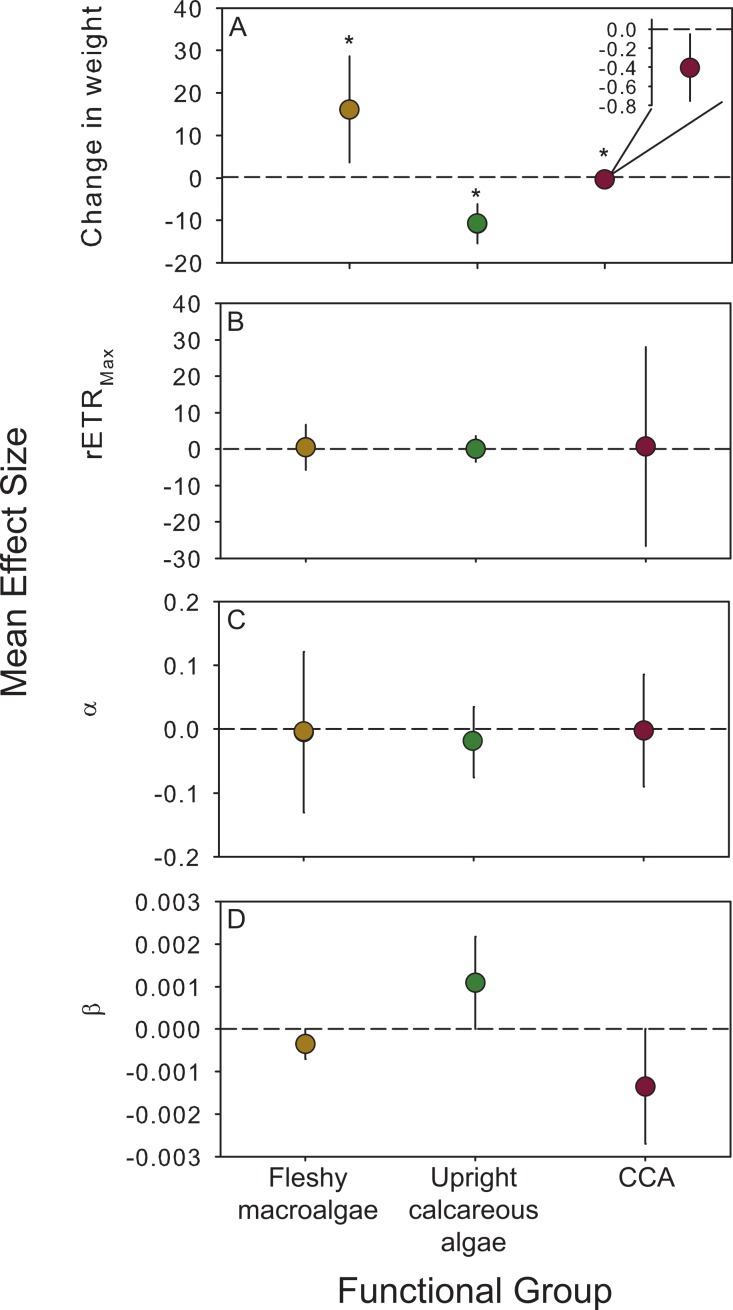
Figure 4. Functional group responses to OA.
Mean (± 95% CI) effect sizes were calculated to explore the cumulative effects of OA on algae categorized into functional groups (fleshy macroalgae, upright calcareous algae, and crustose coralline algae (CCA). Species that reproduced during experiments were not included in this analysis. The dashed line is positioned at zero to indicate a relative increase or decrease following exposure to OA conditions for (A) change in weight, (B) maximum photosynthetic capacity (rETRMax), (C) photosynthetic efficiency (α), and (D) photoinhibition (β). Fleshy macroalgae are shown in brown circles, upright calcareous algae in green, and CCA in red. * Indicates an effect size different than zero as determined by meta-analysis (results reported in Table 4).

