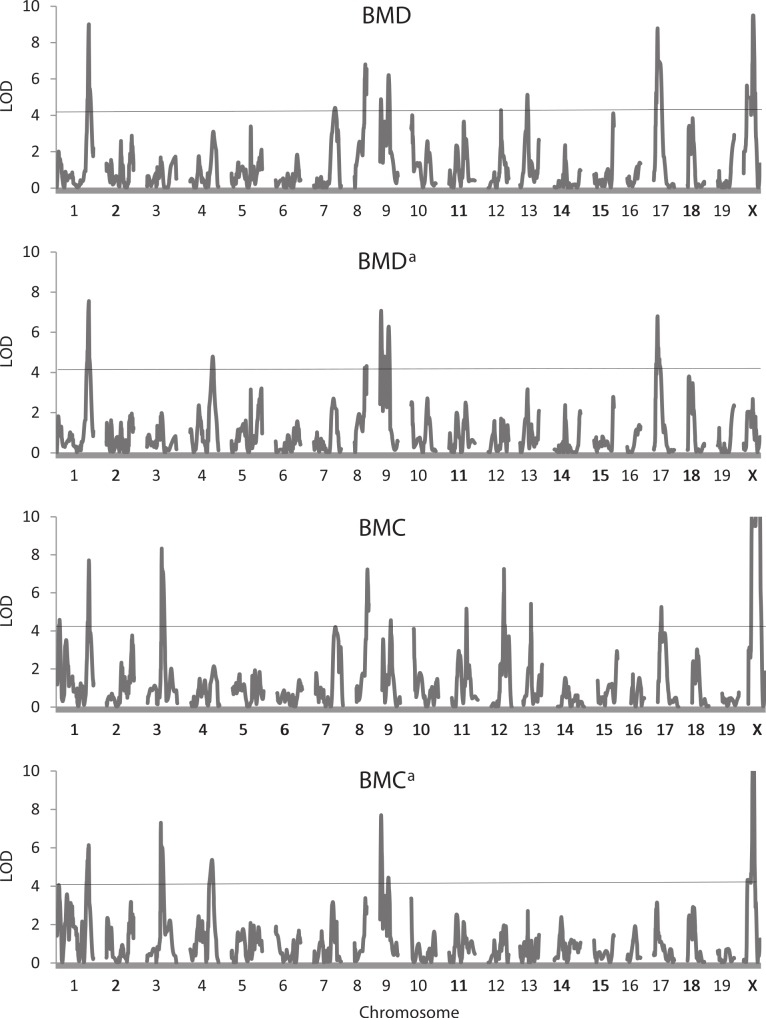
Figure 4. Quantitative trait locus maps of four bone traits.
Shown are distributions of LOD scores on each of the 20 chromosomes for BMD, BMDa, BMC, and BMCa. For BMC and BMCa, LOD scores on the X chromosome are truncated to a maximum of 8). The horizontal line represents the 5% experimentwise threshold level used in determining statistical significance.

