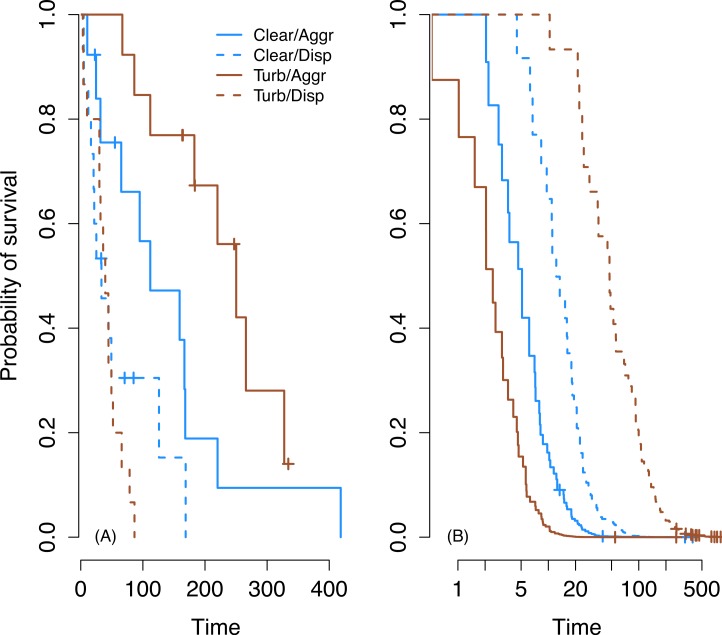
Figure 3. Survival on first prey in trial (A) and subsequent prey (B).
Kaplan–Meier curves for time to discovery of first (A) and subsequent (B) prey. Brown lines represent turbid water and blue lines clear water. Solid lines represent aggregated prey and dashes represent dispersed prey. In (B), the time axis was logged to improve clarity.

