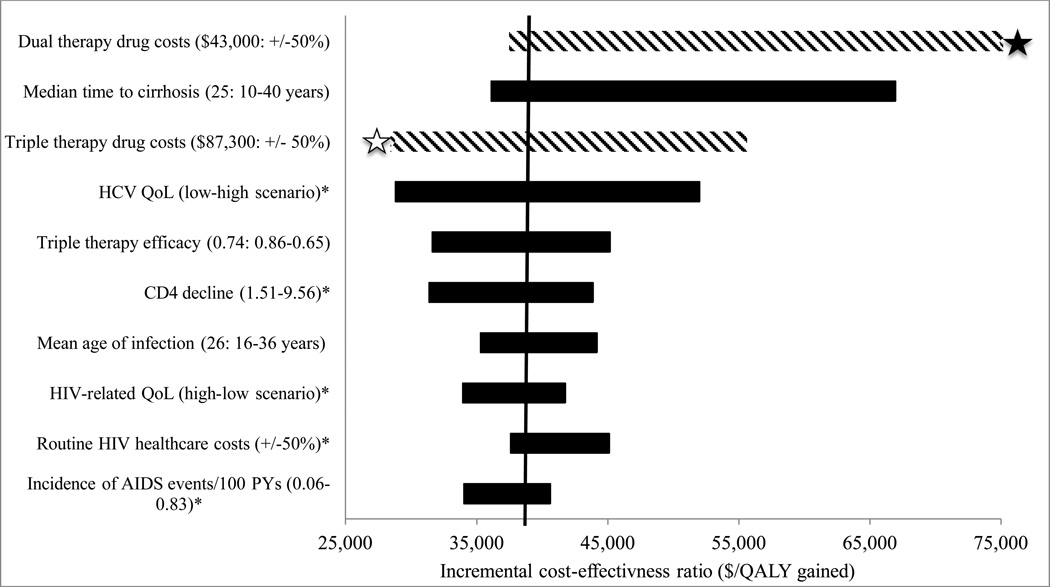
Figure 2. Tornado diagram “PEG/RBV trial” one-way sensitivity analyses.
Tornado diagram illustrating the incremental cost effectiveness ratio (ICER) of the “PEG/RBV trial” strategy compared to its next best alternative when varying model input parameters through plausible ranges. Long bars demonstrate parameters that have a large impact on ICERs. Bars with a striped pattern illustrate parameters that led to the “PEG/RBV trial” strategy becoming dominated by either “IL28B triage” or “triple therapy”, meaning that the other option provided greater life expectancy at a lower cost per QALY gained. The white star indicates that the “PEG/RBV trial” strategy became dominated by “triple therapy.” The black star indicates that the “PEG/RBV trial” strategy became dominated by “IL28B triage.” The asterisk refers to Table 1 for base case values. (QALY= quality-adjusted life years; QoL= quality of life).

