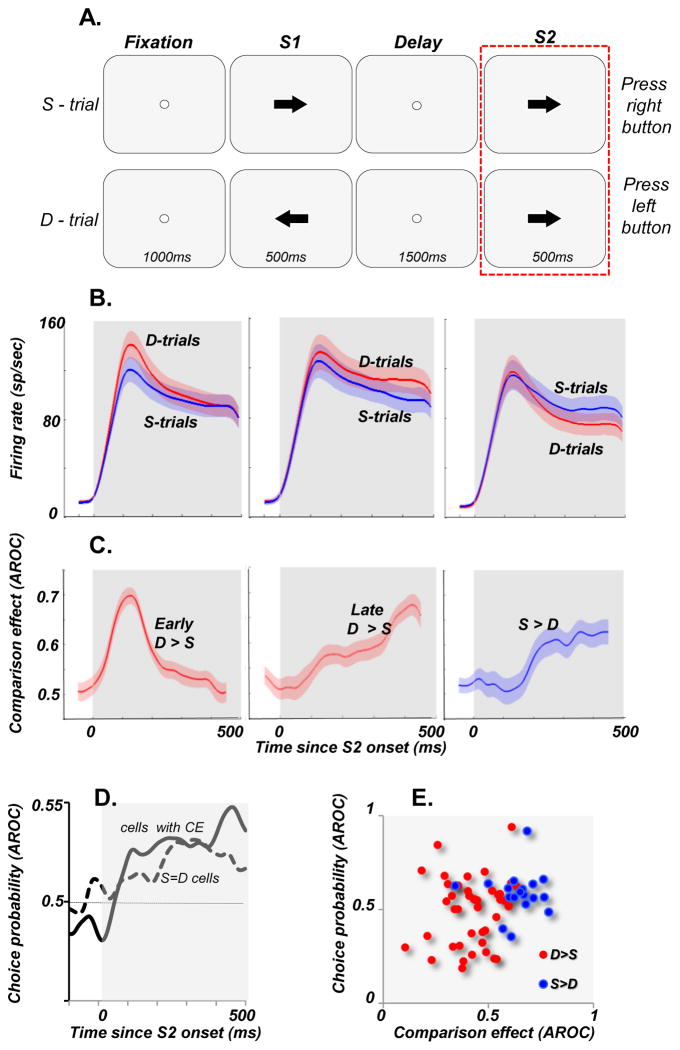
Figure 1. MT activity at the time of decision during comparisons of motion directions.
(A) The diagrams outline the temporal sequences of the events during the task. The monkeys fixated a spot for 1000ms before being presented with two stimuli, S1 and S2, lasting 500ms each and separated by a 1500ms delay. S1 and S2 moved either in the same (S-trials) or in opposite (D-trials) directions. They pressed one of two pushbuttons to report whether S1 and S2 moved in the same or in different directions. The rectangle around the S2 component highlights the portion of the trial analyzed here. During the task stimuli consisted of random dots displaced in directions chosen from a predetermined distribution. The width of this distribution determined the range of directions within which individual dots move and was varied between 0° (all dots moving in the same direction) and 360° (dots moving in random directions). The data in B & C are based on trials with coherent motion (0o range), while the data in D are based on trials with S1 consisting of random motion (360o range). Both stimuli were placed in the neuron’s receptive field (RF) and during S2 moved in the preferred direction for that neuron. (B) Average responses during S-trials (blue curves) and D-trials (red curves). Three distinct groups of cells showed differences in their responses to identical stimuli moving in the neuron’s preferred direction: cells with stronger activity on D-trials early in the response (left plot; early D>S cells, n=34), cells with stronger activity on D trials late in the response (middle plot, late D>S cells, n=27), and cells with stronger activity on S-trials (right plot, S>D cells, n=32). (C) Differences between the two response curves shown in B (i.e. comparison effects), computed with ROC analysis shown separately for each group of cells. (D) Choice probability (CP) computed separately for neurons with comparison effects (CP = 0.53± 0.02; p = 0.145, n = 62) and neurons with no comparison effects (CP = 0.53±0.01, p=0.012; n = 67). Note, that the overall CP for cells with CE failed to reach significance, while neurons with no comparison effects (S=D) showed significant choice-related activity, indicative of higher activity prior to “same” report. However, when CP was computed separately for each cell group, one cell group, showed consistently significant CP (S>D, CP=0.58, p=0.03; see Lui and Pasternak, 2011). (E) Correlation between CE and CP computed for individual cells was weak, failing to reach statistical significance (r=0.24, p=0.06).

