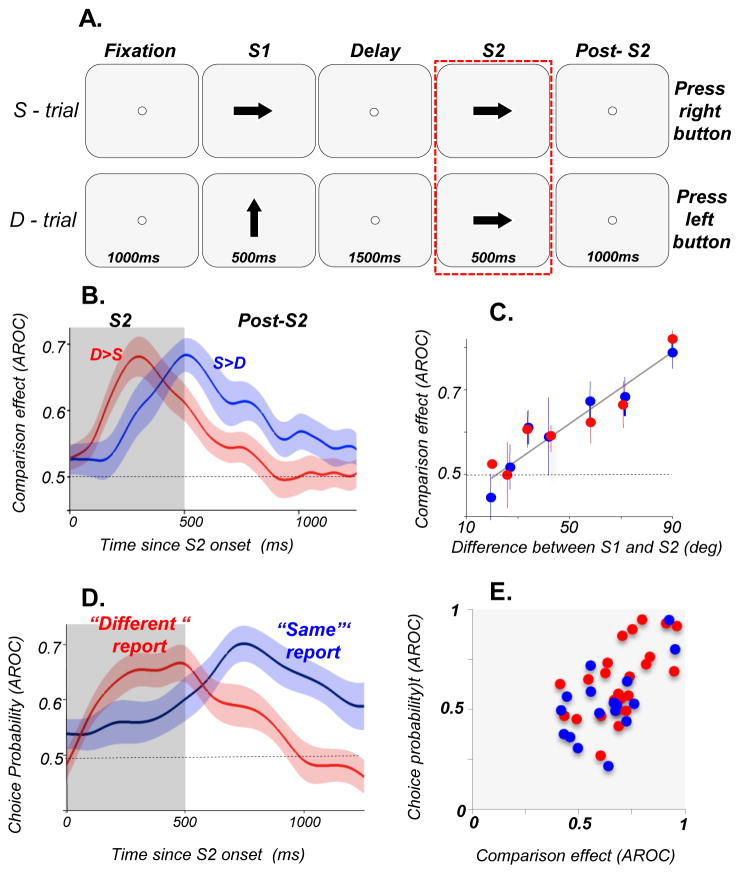
Figure 2. DLPFC activity at the time of decision during comparisons of motion directions.
(A) Diagram of the direction comparison task showing the two types of trials, S-trials and D-trials (Hussar & Pasternak, 2012). On S-trials, S1 and S2 separated by 1500ms delay moved in the same direction while on D-trials, S1 and S2 moved in different directions. The animals reported whether the two directions were the same or different by pressing one of two response buttons. They were allowed to respond 1000ms after S2 offset. During each session, direction difference thresholds were measured by varying the difference between directions in S1 and S2. The rectangle around the S2 trial components highlights the portion of the trial relevant to the analysis described here. (B) Comparison effects (CEs) recorded during and after S2. Average CE for S>D cells (blue, n=20) and D>S cells (red, n=26) during S2 and post-S2. (C) Dependence of CE on the difference in direction between S1 and S2: D>S (red); S>D cells (blue). The correlation between CE and direction difference was highly significant (p<7.5×10⁶). (D) Choice probability of DLPFC neurons more active before “different” (n=24) and before “same” (n=17) reports. Shadings represent ±SEM. (E) Correlation between CE and CP computed for individual S>D and D>S cells which showed both CE and CP. The two measures were strongly correlated during 200–400ms (p=1.3×10⁷) shown here, as well as later in the trial, 600–800ms after S2 onset (not shown; p=1.2×10⁴).

