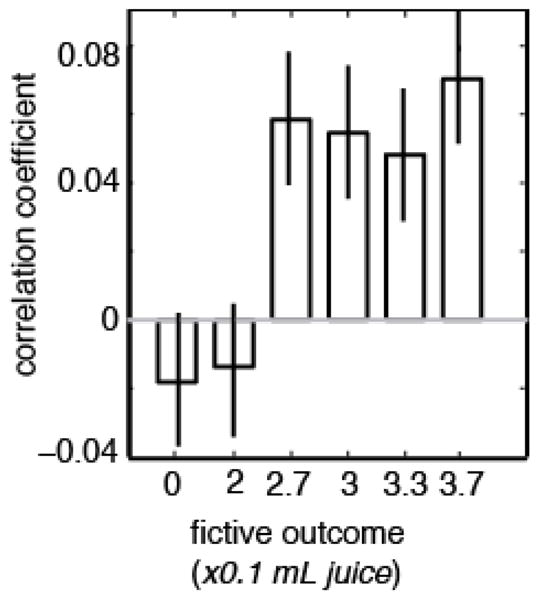
Figure 4. Variation in preference is predicted by variation in firing rate.

Plot of average correlation between firing rate in response to fictive rewards for all neurons in dataset and likelihood that monkey would choose optimally on next trial, separated out by reward sizes. For the four larger fictive rewards (2.7, 3, 3.3, and 3.7), there was a significantly positive correlation between firing rate and strategy on next trial. This analysis has many similarities to the choice probability type of analysis.
