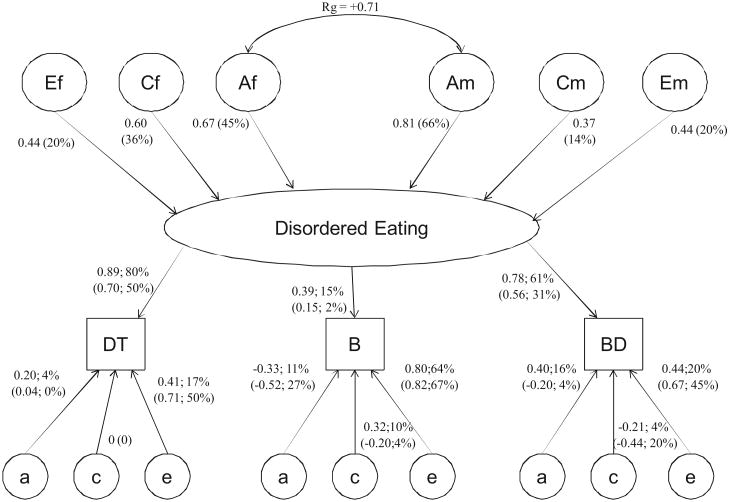
Figure 1.
Genetic and environmental path estimates from multivariate common pathway model including all five zygosity groups. Rg = genetic correlation; Af = female common factor additive genetic path estimate; Cf = female common factor shared environmental path estimate; Ef = female common factor unique environment path estimate; Am = male common factor additive genetic path estimate; Cm = male common factor shared environmental path estimate; Em = male common factor unique environment path estimate; % = squared parameter estimates indicating percentage of variance accounted for by factor; DT = Drive for Thinness subscale; B = Bulimia subscale; BD = Body Dissatisfaction subscale; a = residual additive genetic path estimate; c = residual shared environmental path estimate; e = residual unique environment path estimate. Male path and parameter estimates for factor loadings and residual genetic and environmental factors are indicated in parentheses.

