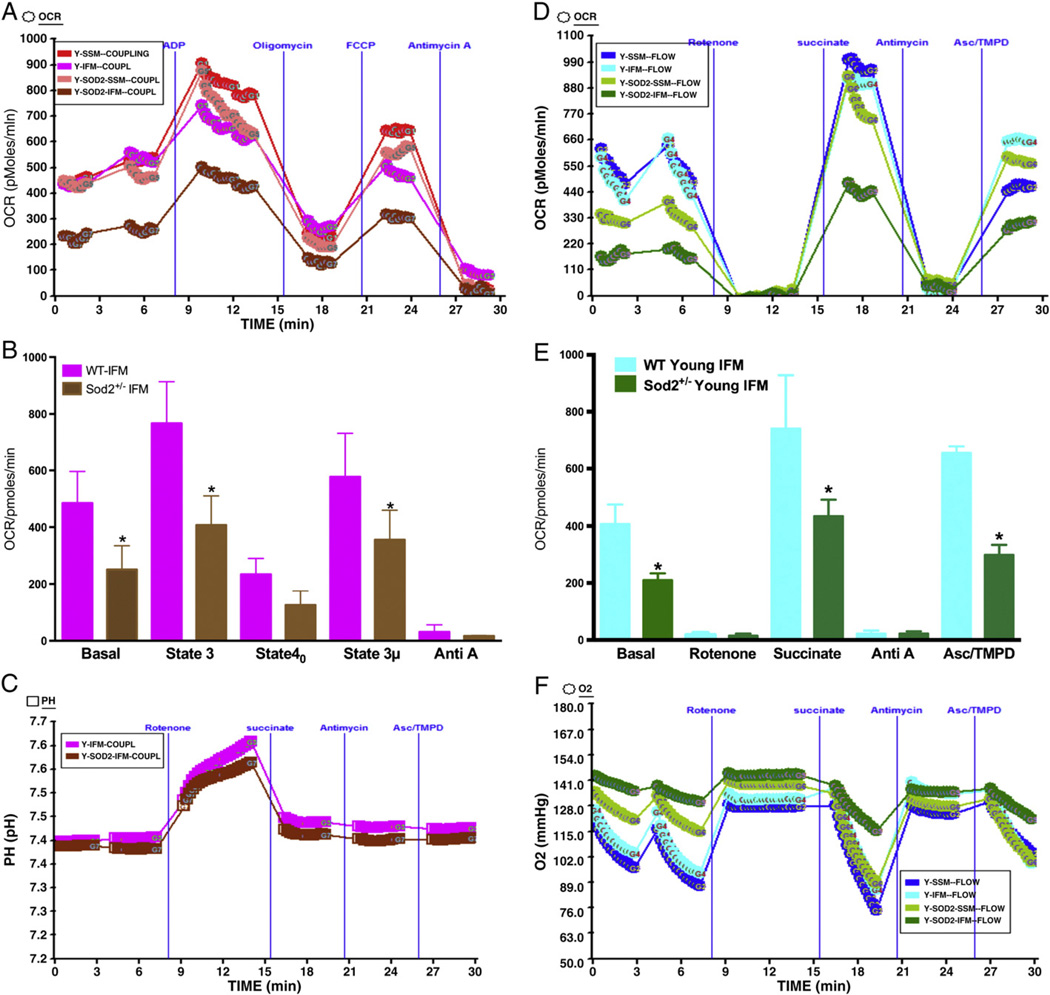
Fig. 7.
Mitochondrial function in SSM and IFM of Young WT mice and Young Sod2+/− mice heart: (A) a representative figure of mitochondrial coupling; basal (state 2), state 3, state 40, state 3 µ and antimycin A respirations in young WT (3–5 months) and young Sod2+/− (6–7 months) mice heart SSM and IFM mitochondria. (B) Basal (state 2), state 3, state 40 and antimycin A respiration in young WT or young Sod2+/− mice heart mitochondria (n = 3 each). (C) The absolute pH levels in the micro-chamber due to ADP, oligomycin, FCCP and antimycin A injections; (D) a representative figure of OCR measurements in XF24 due to electron flow in the mitochondria using pyruvate and malate as substrates, and its modulation due to injections of rotenone, succinate, antimycin A and Asc/TMPD; in young WT or young Sod2+/− mice; (E) graph of OCR of young WT or young Sod2+/− mouse mitochondria with state 3 µ, succinate, antimycin A and Asc/TMPD mediated OCR (n = 3); (F) absolute oxygen levels in the micro-chamber.

